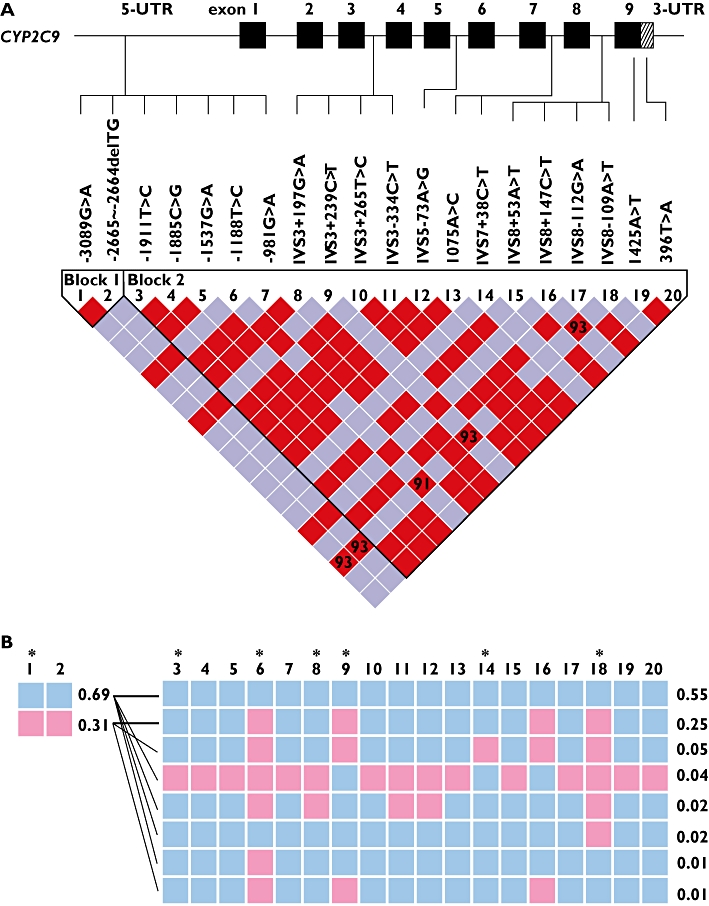
Figure 1.

Linkage disequilibrium (LD) map of CYP2C9 single nucleotide polymorphisms obtained from normal healthy subjects (n= 50). CYP2C9 variants at >5% were included in the LD analysis using the statistics |D′| and r2 values [23]. A) Sequential arrangement of CYP2C9 SNPs along with their locations in the CYP2C9 gene. The red colour depicts a significant linkage between the pair of SNPs. Numbers inside the square are the D′ value multiplied by 100. B) CYP2C9 SNPs and their occurrence in common haplotype structures in two blocks. Frequency of each haplotype is shown at the edge. The blue square indicates the most common allele and the pink colour represents the variant allele. The selected tag SNPs are indicated by the star symbol. The thick black lines between haplotypes indicate the most common crossings from block 1 to block 2 and thinner lines mark the less common crossings.
