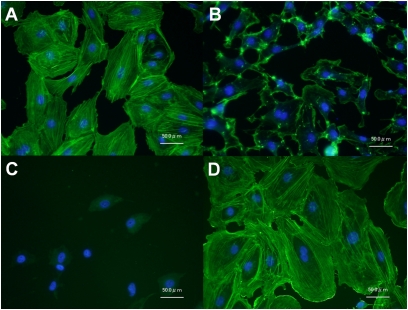
Figure 7.
Representative images of control cells (A) and cells treated with 0.1 μM cytochalasin D (15 min; B), 0.5 μM jasplakinolide (15 min; C), and 1 μM S1P (30 min; D), on actin polymerization. Nuclei and F-actin were visualized using Alexa488-conjugated phalloidin and DAPI, respectively. Fluorescence from F-actin was negligible in cells treated with jasplakinolide because jasplakinolide competitively binds to F-actin at the same binding sites as phalloidin (C).

