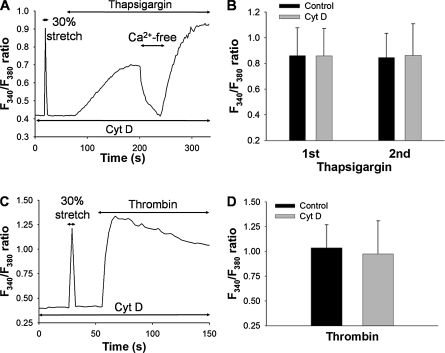
Figure 8.
Effects of actin disruption with 0.1 μM cytochalasin D (Cyt D) on F340/F380 ratio induced by 1 μM thapsigargin or 10 U/ml thrombin. (A) Representative trace of F340/F380 ratio by stretching to 30% strain, and 1 μM thapsigargin after treatment with 0.1 μM cytochalasin D for 15 min After extracellular solution was changed to Ca2+-free solution for 40 s, 2 mM Ca2+ was re-added to the solution. (B) Levels of F340/F380 ratio in response to thapsigargin before (1st) and after (2nd) exposing Ca2+-free solution, with (Control) or without 0.1 μM cytochalasin D treatment. Bars represent means ± SD (n = 5). (C) Representative trace of F340/F380 ratio induced by 30% strain and 10 U/ml thrombin after treatment with 0.1 μM cytochalasin D for 15 min. (D) Levels of F340/F380 ratio in response to 10 U/ml thrombin with (Control) or without 0.1 μM cytochalasin D treatment. Bars represent means ± SD (n = 5).

