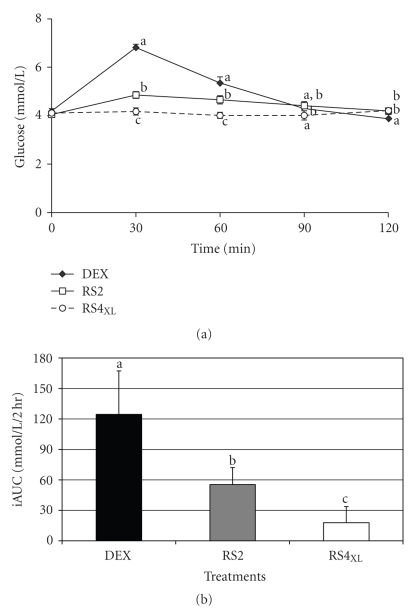
Figure 1.
The glucose responses to 30 g of carbohydrate from three treatments (DEX, RS2 and RS4XL). Panel (a) depicts the glucose changes over time, while panel (b) depicts the incremental area under the glucose curve. Data presented are mean±SE; significance was set at P < .05; and, different letters indicate difference between treatments.

