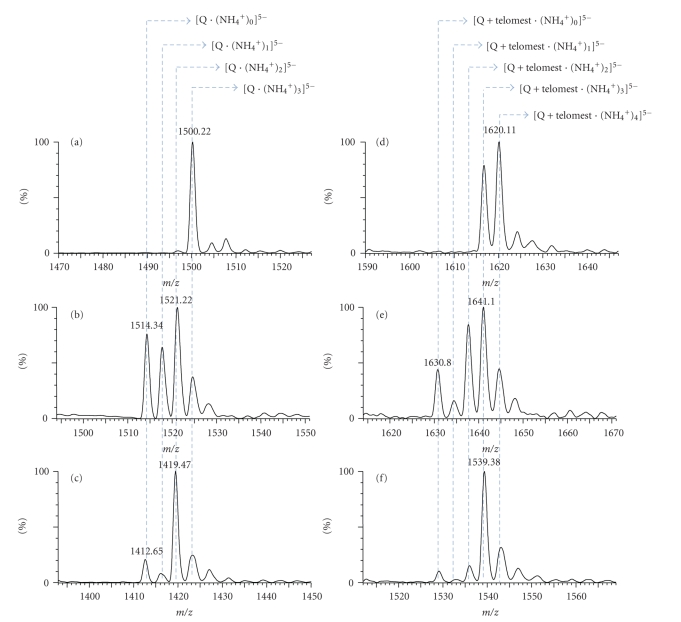
Figure 2.
Negative ion mode electrospray mass spectra of mixtures of 10 μM telomestatin and 5 μM of G-quadruplexes. Zooms on the peaks of free G-quadruplex (a) [TG4T]4, (b) telomeric sequence (T2AG3)4, and (c) Pu22myc promoter sequence GAG3TG4AG3TG4A2G, and on the complexes between (d) one telomestatin and [TG4T]4, (e) one telomestatin and (T2AG3)4, and (f) one telomestatin and GAG3TG4AG3TG4A2G. The spectra were recorded from and 80/20 aqueous ammonium acetate (150 mM)/methanol solution, using soft source conditions to preserve the specifically bound ammonium ions.

