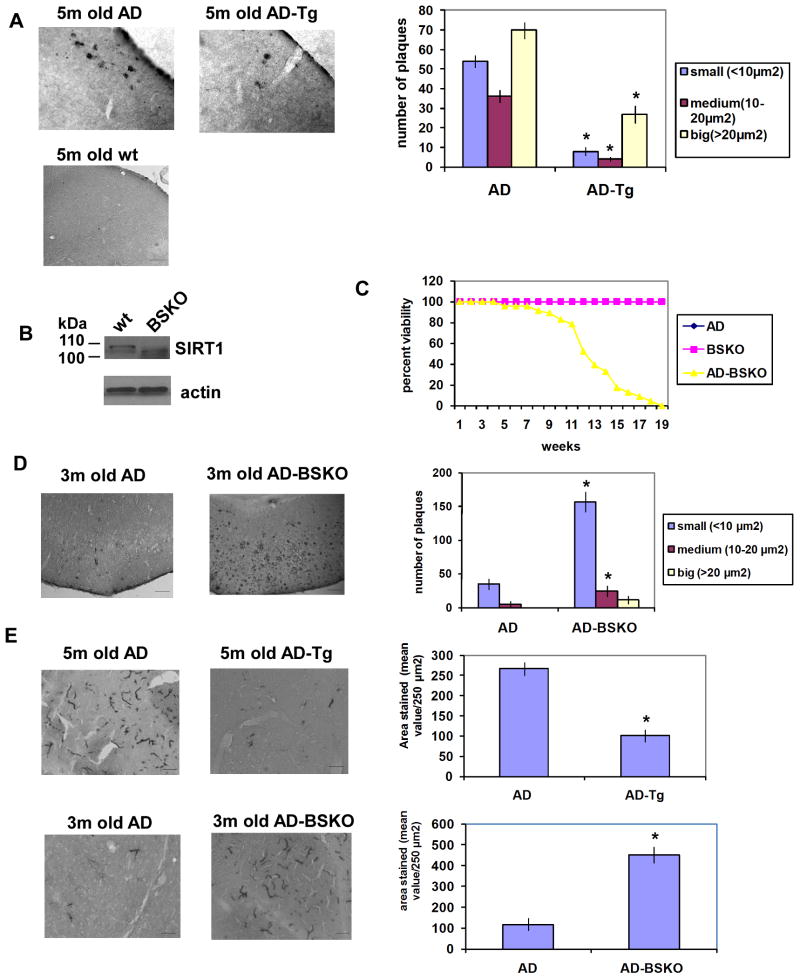
Figure 1. SIRT1 levels regulate the pathology in a mouse Alzheimer's Disease model.
(A) Cortical frozen sections (6 per mouse) of fixed brains from indicated mice (ages in months (m)) stained with Aβ specific 6E10 antibody. The graph on the right shows the quantification of the amyloid plaques according to their sizes in APPswe,PSEN1dE9 mice with endogenous SIRT1 (AD) and with a SIRT1 transgene (AD-Tg), n=5. Left shows examples of stained samples from these and wild type (wt) mice. Scale bar, 50 μm. * indicates p< 0.01 throughout in students t test. (B) Western blot analysis of SIRT1 expression in wild type (wt) and SIRT1 brain specific knockout mouse (BSKO) whole brains. Deletion of exon 4 resulted in the truncated inactive form of SIRT1 in BSKO mice. β-actin served as a loading control. (C) Survival curve of the percent viability of the AD, BSKO and AD-BSKO mice. n= 47 for AD-BSKO and BSKO and n= 45 for AD mice. Both BSKO and AD mice showed 100 % viability. (D) Cortical frozen sections of fixed brains from indicated mice stained with Aβ specific 6E10 antibody. The graph on the right shows the quantification of the amyloid plaques. Scale bar, 50 μm. n=5 (E) Frozen sections of fixed brains from indicated mice stained with GFAP (glial fibrillary acidic protein) antibody for gliosis. The graph on the right shows the quantification of the GFAP staining. Scale bar, 50 μm. (see also Figure S1)

