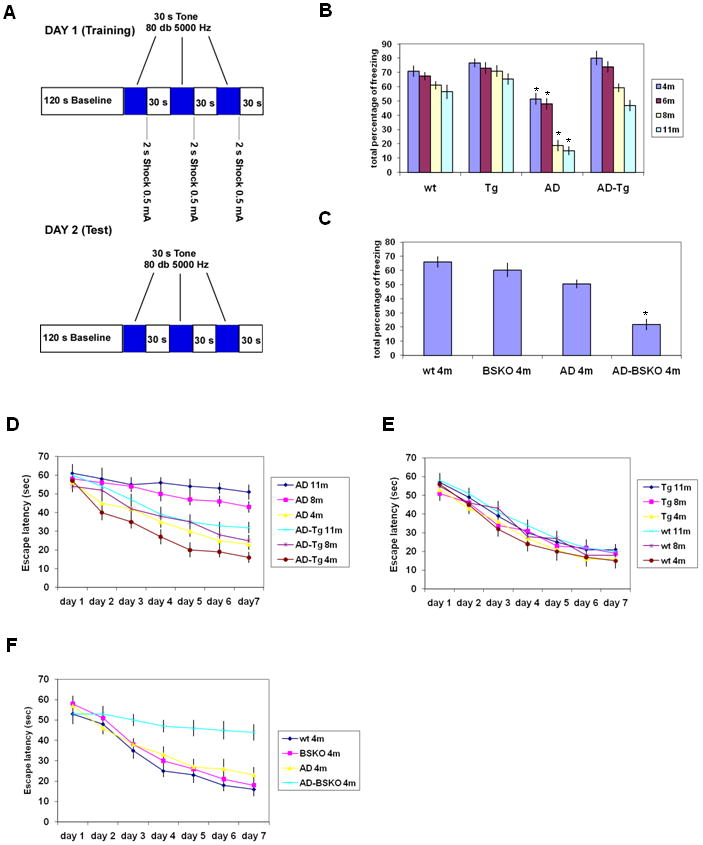
Figure 2. SIRT1 improves the behavioral phenotype of Alzheimer's Disease mouse model.

(A) Schema of the fear conditioning experiment. (B) The graph shows the total percentage of freezing (on day 2) of the wt, Tg, AD and AD-Tg mice of the indicated ages across the entire 5-min tone retrieval test. n=10-15 for each bar. (C) The graph shows the total percentage of freezing of the wt, BSKO, AD and AD-BSKO mice at 4 months of age across the entire 5-min tone retrieval test. n=10-15 (D) Morris water maze experiment (D-F). Escape latency (time to find the platform) was plotted for 7 days for 11, 8 and 4 months old of AD and AD-Tg mice. n= 6-12 (E) Escape latency plotted over 7 days for 11, 8 and 4 months old of Tg and wt mice. n=6-12 (F) Escape latency plotted over 7 days for 4 months old of wt, BSKO, AD and AD-BSKO mice. n=6-12 (see also Figure S1)
