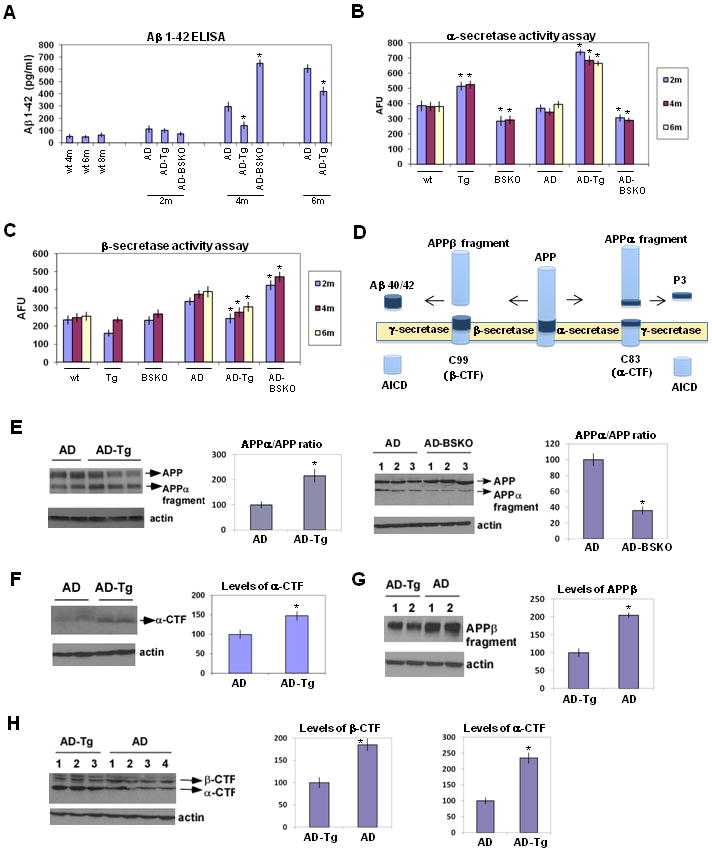
Figure 3. SIRT1 reduces Aβ levels and increases α-secretase activity.

(A) Aβ 1-42 levels measured using ELISA from the whole brains of the indicated mice. n=6 for each bar. (B) α-secretase activity from the whole brains of indicated mice using an activity assay. n=6 AFU, arbitrary fluorescence units (C) β-secretase activity in the whole brains of indicated mice. n=6 (D) The scheme of the proteolytic processing of APP. Aβ 40/42, amyloid β peptide with 40 (Aβ 1-40) or 42 amino acid residues (Aβ 1-42); APP, amyloid precursor protein; AICD, APP intracellular domain; sAPPα, soluble APP after α-secretase cleavage (alpha-fragment); sAPPβ, soluble APP after β-secretase cleavage; C99, C-terminal fragment of APP of 99 amino acids after β-secretase cleavage; C83, C-terminal fragment of APP of 83 amino acids after α-secretase cleavage (α-CTF); P3, N-terminal fragment of C83 after α-secretase cleavage. (E) Western blotting of the whole brains of indicated mice of 6 months of age using 6E10 antibody. β-actin serves as the loading control. Quantification of the APPα/APP ratio is shown on the right as percent of control. (F) Western blotting of the whole brains of indicated mice of 6 months of age using APP C-terminal antibody. β-actin serves as the loading control. Quantification of the α-CTF is shown on the right as percent of control. (G) Western blotting of the whole brains of indicated mice of 6 months of age using APPβ antibody. β-actin serves as the loading control. Quantification of the APPβ fragment is shown on the right as percent of control. (H) Western blotting of the whole brains of indicated mice of 6 months of age using a different APP C-terminal antibody (see Experimental Procedures) from Figure 3F which can detect both α-CTF and β-CTF. β-actin serves as the loading control. Quantification of the α-CTF and β-CTF are shown on the right as percent of control. (see also Figure S2)
