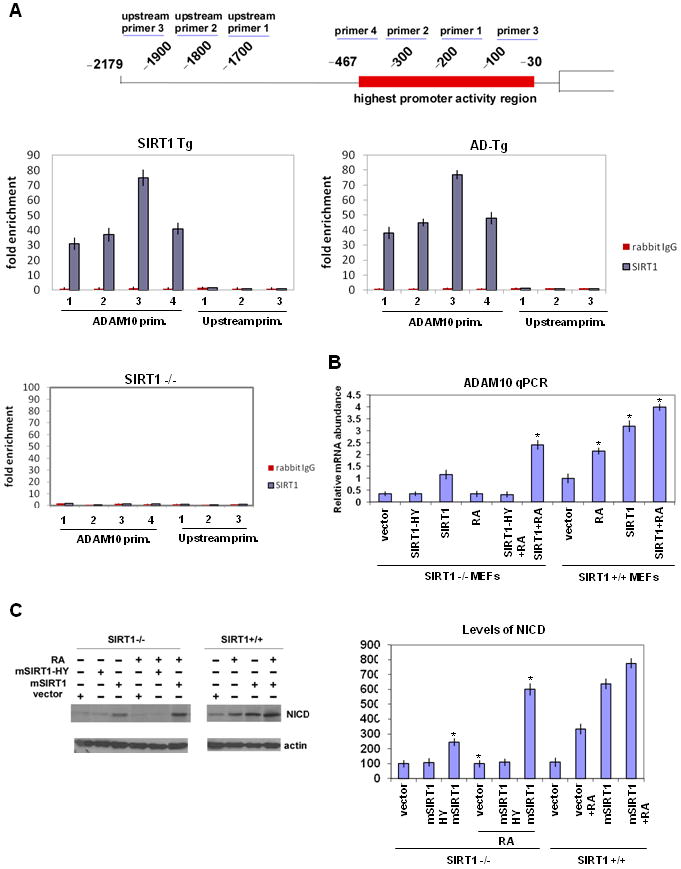
Figure 5. SIRT1 suppression of Aβ production is mediated by ADAM10.

(A) Chromatin-immunoprecipitation on whole brains of 6 months old SIRT1 Tg, AD-Tg and SIRT1-/- mice with anti-SIRT1 antibody or IgG. The scheme illustrates the highest activity region of the ADAM10 promoter and the primers used for q-PCR in assay. q-PCR was performed using primers as indicated (see Experimental Procedures). SIRT1-/-mice were in a mixed genetic background to allow recovery of viable adults (McBurney et al. 2003). (B) ADAM10 RNA levels quantified by q-PCR from the SIRT1+/+ or SIRT1-/- MEFs transfected with mSIRT1 or mSIRT1-HY and/or treated with retinoic acid (RA). (C) NICD levels determined by western blotting from the SIRT1+/+ or SIRT1-/- MEFs transfected with mSIRT1 or mSIRT1-HY and/or treated with retinoic acid (RA). β-actin serves as the loading control. Quantification of NICD levels is shown on the right as percent of control. (see also Figure S4)
