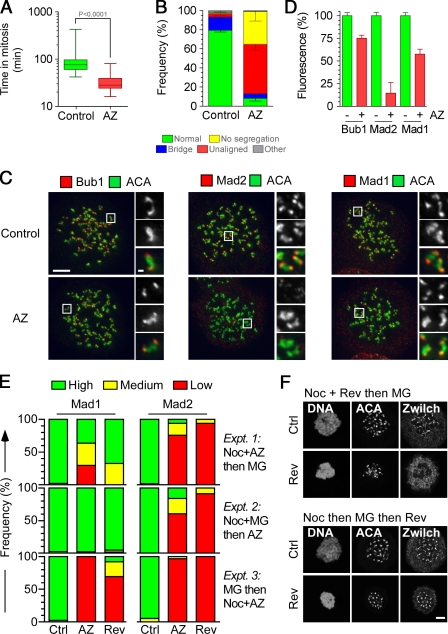
Figure 2.
AZ3146 compromises SAC function and inhibits Mad2 localization. (A) Box and whisker plot of HeLa GFP-H2B cells treated with or without AZ3146 (AZ) and analyzed by time-lapse microscopy, showing the time from nuclear envelope breakdown to chromosome decondensation. Values were derived from ≥75 cells. (B) Bar graph quantifying mitotic phenotypes. Values were derived from ≥115 cells. (C) Images of HeLa cells treated with nocodazole and MG132 for 2 h with or without AZ3146, fixed, and stained to detect centromeres (ACA) and either Bub1, Mad1, or Mad2. Insets show higher magnification views of individual kinetochore pairs (boxed regions). (D) Bar graph quantifying pixel intensities at kinetochores normalized to ACA in mitotic HeLa cells treated with or without AZ3146. Values were derived from ≥228 kinetochores. (E) Bar graphs scoring kinetochore staining of Mad1/2 as high, medium, or low after exposure to nocodazole (Noc) or MG132 (MG) plus either AZ3146 or reversine (Rev). Data were derived from a two experiments in which at least 50 cells were counted per condition. (F) Images of HeLa cells stained to detect Zwilch and centromeres after exposure to nocodazole, reversine, and MG132 in the sequences indicated. AZ3146 was used at 2 µM and reversine at 500 nM. Ctrl, control. Error bars indicate SEM. Bars: (C and F) 5 µm; (C, insets) 0.5 µm.

