Figure 2.
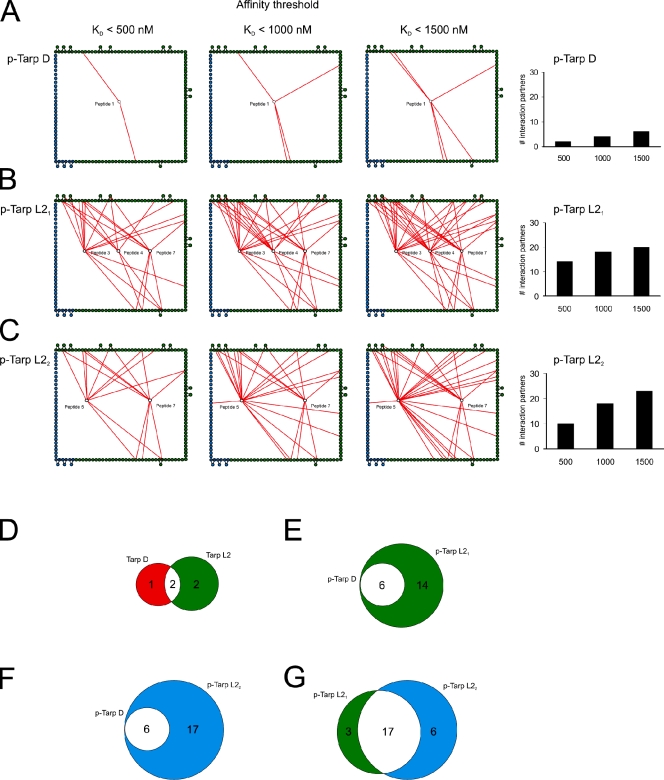
Quantitative analysis of the phospho-interactome. Interaction networks of the phospho-states from Fig. 1 were binned using three different affinity thresholds (KD < 500 nM, KD < 1000 nM, and KD < 1500 nM). In A–C, only peptide–domain interactions below the stated threshold are shown (red lines). Edge nodes are colored as in Fig. 1. p-Tarp D refers to phosphorylated Tarp from C. trachomatis serovariant D; p-Tarp L21 and L22 refer to singly and doubly phosphorylated Tarp from serovariant L2, respectively. (A) Tarp D is less promiscuous than Tarp L2 and has few interaction partners at all affinity thresholds. (B) Tarp L21 exhibits highly promiscuous binding even at the highest affinity threshold (KD < 500 nM). (C) Tarp L22 has fewer high-affinity interaction partners (KD < 500 nM) than Tarp L21, but the number of interactors increases sharply as the affinity threshold is relaxed. To the right, the number of Tarp interaction partners at each affinity threshold is depicted in bar diagrams. Multiple domains from proteins interacting with more than one phospho-site are only counted once. (D–G) Venn diagrams showing the number of overlapping interactions (white) between nonphosphorylated Tarp D (red) and L2 (green) (D), singly phosphorylated Tarp D (red) and L21 (green) (E), singly phosphorylated Tarp D (green) and doubly phosphorylated L22 (blue) (F), and singly phosphorylated Tarp L21 (green) and doubly phosphorylated L22 (blue) (G).

