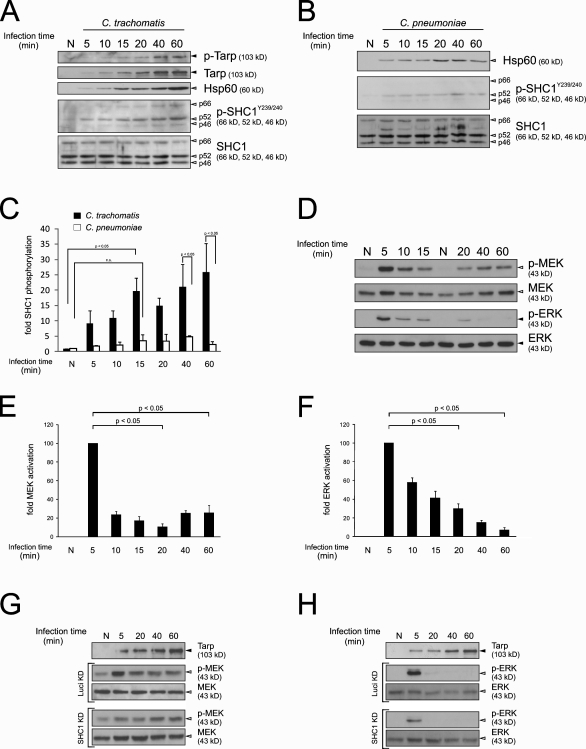
Figure 4.
SHC1, MEK, and ERK are activated during early chlamydial infection. Western blots showing SHC1 phosphorylation on tyrosine residues Y239/240 (p-SHC1Y239/240, white arrowheads) and Tarp phosphorylation (p-Tarp, black arrowheads) during a time-course infection experiment (C. trachomatis L2, MOI 200; HeLa cells) (A) and a control experiment using C. pneumoniae TWAR (MOI 200, HeLa cells) showing only marginal SHC1 phosphorylation on tyrosine residues Y239/240 (p-SHC1Y239/240, white arrowheads) (B). Tarp phosphorylation was determined through use of a tyrosine phosphorylation–specific antibody. Hsp60 was used as an infection control (gray arrowhead). (C) Densitometric quantification of SHC1 p52 Y239/240 phosphorylation. Values were calculated from A and B and normalized to total SHC1 p52 (n = 2, error bars indicate standard error [SE]). (D) MEK (white arrowheads) and ERK (black arrowheads) phosphorylation during a time-course infection experiment (C. trachomatis L2, MOI 200; HeLa cells). MEK and ERK show a phosphorylation peak at ∼5 min. Densitometric quantification of MEK phosphorylation (E) and ERK phosphorylation (F). Values were calculated from D and normalized to total MEK and ERK, respectively (n = 2, error bars indicate SE). All values are normalized to the “5 minutes” infection time point. (G and H) Western blots showing MEK (G) and ERK phosphorylation (H) during an infection time course (C. trachomatis L2, MOI 200; HeLa cells). Cells were either treated with siRNA against Luciferase (control) or SHC1. MEK and ERK activation were reduced upon infection. (A, B, G, and H) Controls (N) were mock infected with SPG for 60 min.

