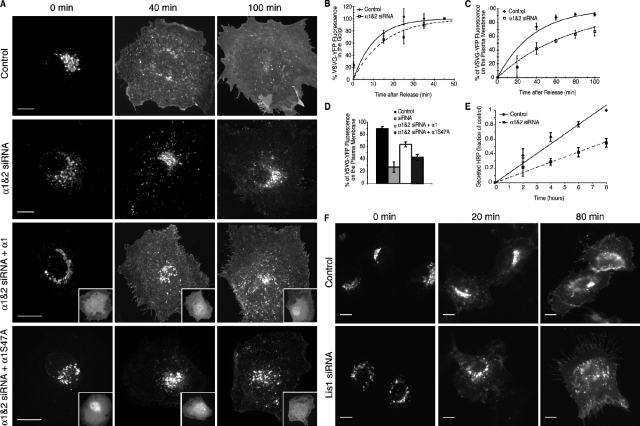
Figure 5.
PAFAH Ib α1 and α2 are important for the transport of both transmembrane and soluble cargo. (A) Confocal stacks of ts045VSV-G-YFP after release from a 20°C TGN block in control, α1 and α2 siRNA-transfected, and either α1 and α2 siRNA + RNAi-resistant α1 or catalytic mutant α1 S47A-transfected BTRD cells. Insets show anti-HA, indicating α1 or α1 S47A-transfected cells. (B) Anterograde transport of ts045VSV-G from the ER to the Golgi. VSV-G-YFP fluorescence in the Golgi after release from a 40°C block to 20°C. Lines correspond to first order kinetic equations: control k = 0.10 ± 0.02 and siRNA k = 0.07 ± 0.02, ± SEM. Difference in kinetic constants was not statistically significant; P < 0.25 (t test). (C) Fluorescence intensity of post-TGN VSV-G-YFP fluorescence after release from 20°C. Lines correspond to first order kinetic equations, control k = 0.027 ± 0.005 and siRNA k = 0.013 ± 0.003, ± SEM; P < 0.05 (t test). (D) Fluorescence intensity of post-TGN VSV-G-YFP fluorescence after release from 20°C for control, α1 and α2 siRNA, and siRNA cells transfected with RNAi-resistant α1 or α1 S47A (catalytic mutant). (B–D) n = 3–4; error bars = SEM. (E) Secretion of ssHRP-Flag in control and α1 and α2 siRNA treated BTRD cells. Media HRP activity was measured and normalized to total HRP expression, expressed as a fraction of secreted HRP at 8 h in control cells. The rates of secretion were: control = 0.121 ± 0.003, α1 and α2 siRNA = 0.068 ± 0.008, ± SEM; n = 8; error bars = SEM. (F) VSV-G-YFP is transported from the Golgi to the plasma membrane in LIS1 siRNA-treated BTRD cells with rates similar to control cells, as seen by wide-field fluorescence. Bars, 10 µm.

