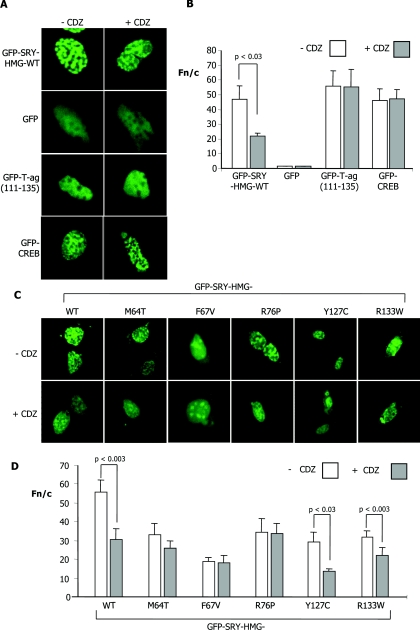
Figure 4. Specific inhibition of SRY nuclear accumulation by the CaM antagonist CDZ; CaM-NLS mutations prevent inhibition by CDZ.
GC-2 cells were transiently transfected to express the indicated GFP-fusion proteins, treated with or without 5 μM CDZ 12 h p.t., and then imaged live 12 h later by CLSM using a 40× water-immersion objective. (A) Confocal images indicate the localization patterns of WT GFP–SRY-HMG and the control proteins GFP, GFP–T-ag-(111–135) and GFP–CREB-(252–341). (B) Results of quantitative analysis, whereby CLSM images such as those in (A) were analysed as described in Figure 1(C). Results are means±S.E.M. (n>13) with significant differences between values in the presence and absence of CDZ denoted by the P values. (C) Confocal images of typical cells indicating localization patterns of the GFP–SRY-HMG WT and NLS mutant proteins, in the absence and presence of CDZ. (D) Results for quantitative analysis (mean±S.E.M.; n>22), from a single typical experiment, from a series of at least three similar experiments; P values are indicated where the Fn/c values are significantly different for constructs in the presence of CDZ.

