
Figure 3.
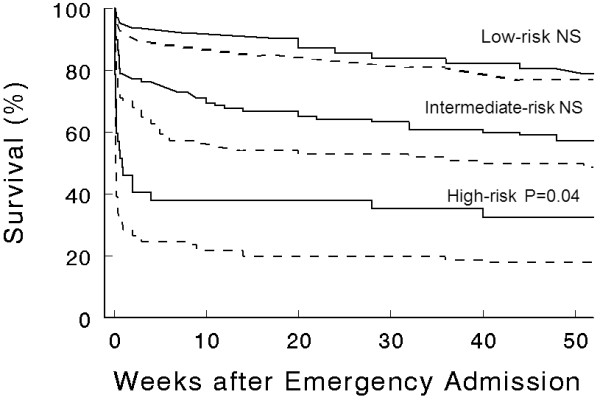
Kaplan-Meier Survival Curves in patients with or without elevation of cardiac troponin I according to the risk score categories (low-, intermediate-, and high-risk sub-groups, n = 90, 229 and 147 respectively), as previously defined [11]. P-values refer to difference between groups with or without elevation of cTnI. NS, non significant.