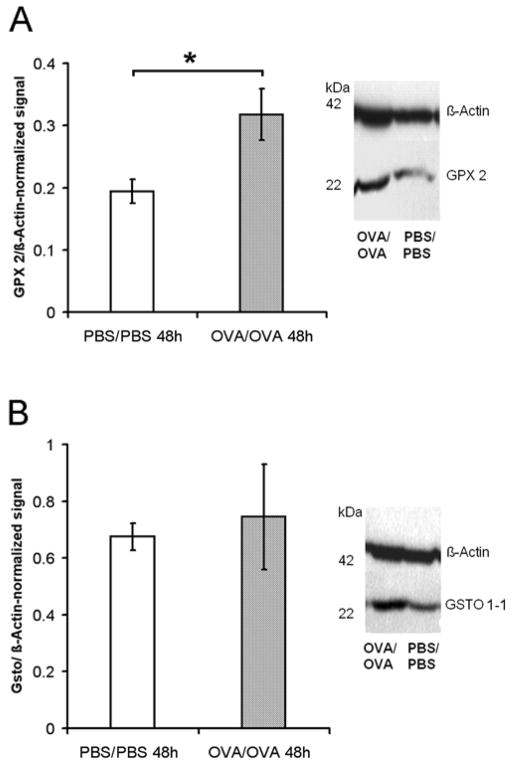
Figure 2. Gpx-2 and GSTO 1-1 protein levels in murine lungs.
Relative quantity of Gpx-2 (A) or GSTO 1-1 (B) protein levels were compared to protein levels of ß-actin using integrated density values from western blot analysis (right hand of the graph) 48h after last challenge. * p ≤ 0.05, Mann-Whitney-test.

