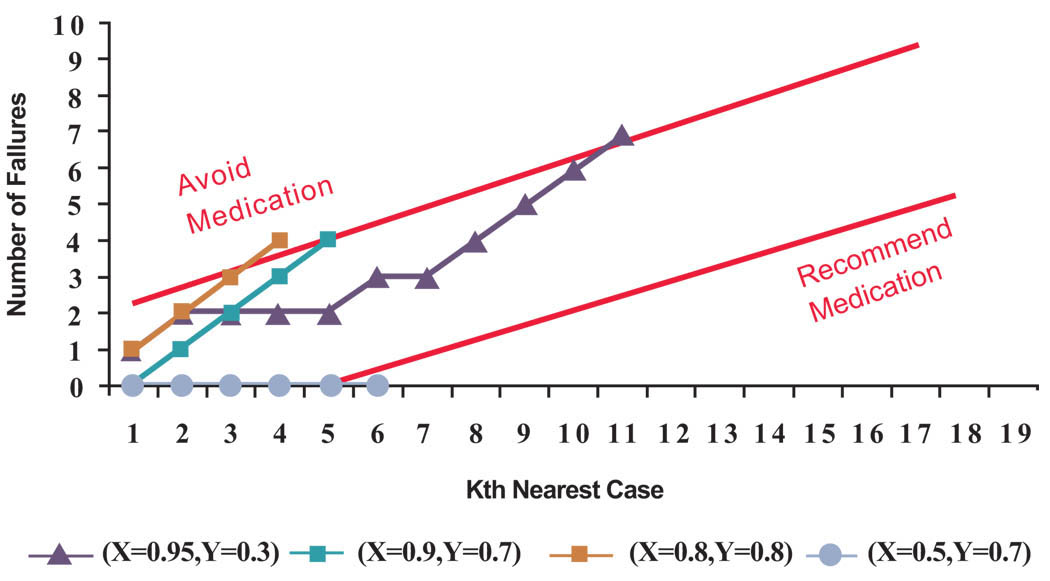
Fig. (4). Cases in which the algorithm makes a recommendation.
(The X and Y corrdinates in the legend correspond to principal components of cases depicted in Fig. (2). For each case, next nearest neighbor was added to the analysis until the number defective was outside the upper or lower control lines).

