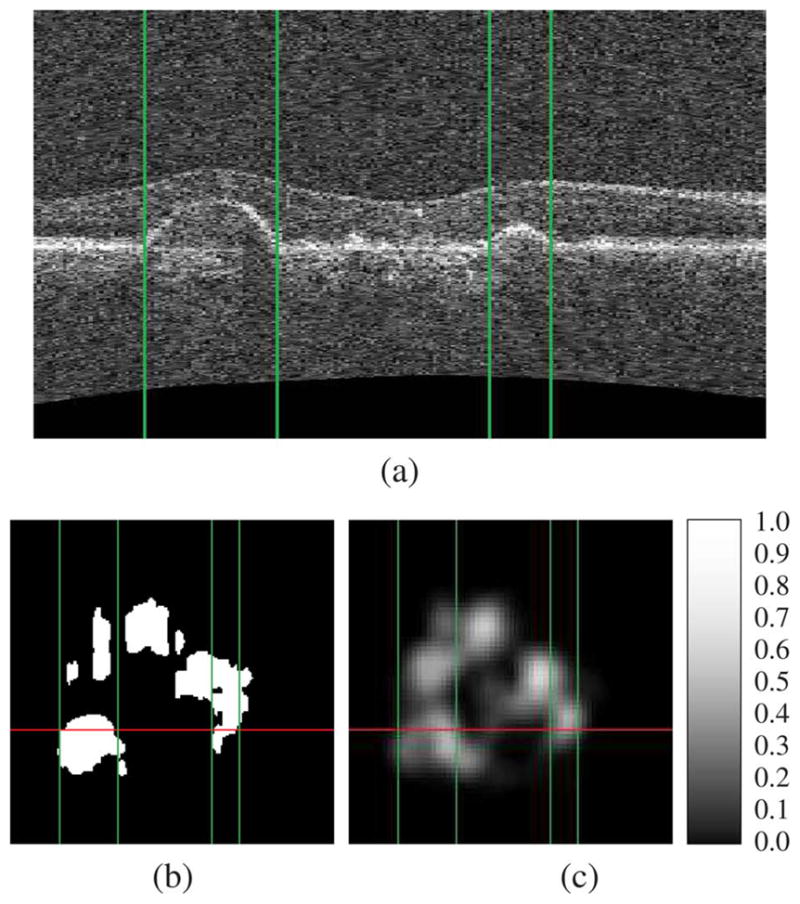
Fig. 4.

Example of SEAD footprint detection. Figure (a) presents an x — z slice running through SEADs in an SD-OCT volume. The expert standard for the footprint of these SEADs and the automatically generated SEAD footprint probability map, in the x — y plane, are presented in figures (b) and (c) respectively. Note the probability scale in panel (c). The projection of the x — z slice in the x — y plane is represented by a vertical line in figure (b) and (c). The location of the layer detachments observed in figure (a) are indicated by vertical lines in each panel.
