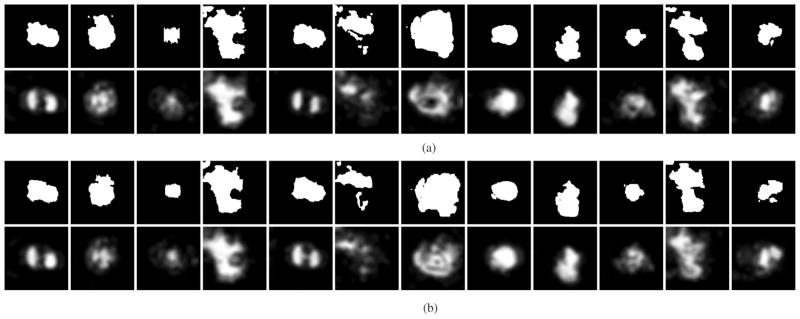
Fig. 8.
Repeatability study—Two scans from the same eye were acquired on the same day at close temporal intervals. For each panel (a), (b), the upper row shows the binary SEAD footprint representing the independent standard. The lower row shows the SEAD footprints obtained by our automated method, the gray levels represent the probability of the point belonging to the SEAD footprint; probability scale is provided in Fig. 4(c). These probabilities were thresholded to arrive at a binary segmentation, varying the threshold levels yielded the ROC curves given in Fig. 6.

