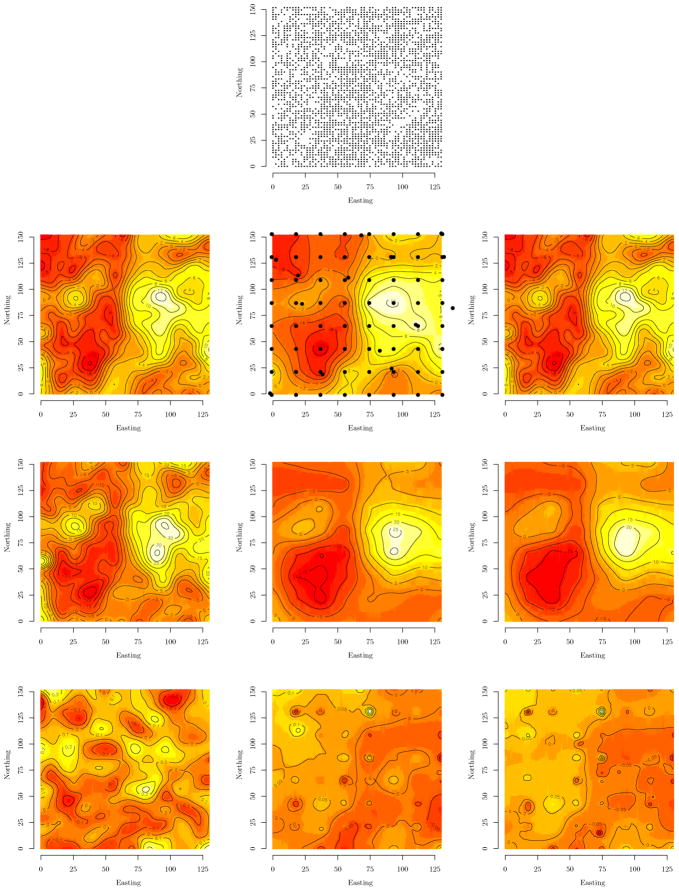
Figure 3.
First row: Each point represents a scots pine tree location. The left column shows interpolated surface of nonspatial model residuals for stem height (H), diameter (D), and branch angle (A), respectively from top to bottom. The middle and right columns show associated estimated surfaces of spatial random effects for the 78 and 160 knot intensities modeled with the stationary isotropic Matérn correlation function. Note that to reduce clutter, the knots are overlaid on only the 78 knot H surface.

