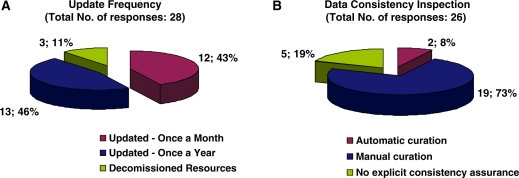
Figure 4.
Pie charts representing the curatorial information for each biological database and resource. Forty-three percent of resources are updated on a monthly basis, 46% annually and the remaining 11% corresponds to resources that have become decommissioned (A). Seventy-three percent of resources are curated manually, 8% use an automatic curation system, and 19% of resources have no explicit way of assuring data consistency with regard to the displayed information (B).

