Figure 2.
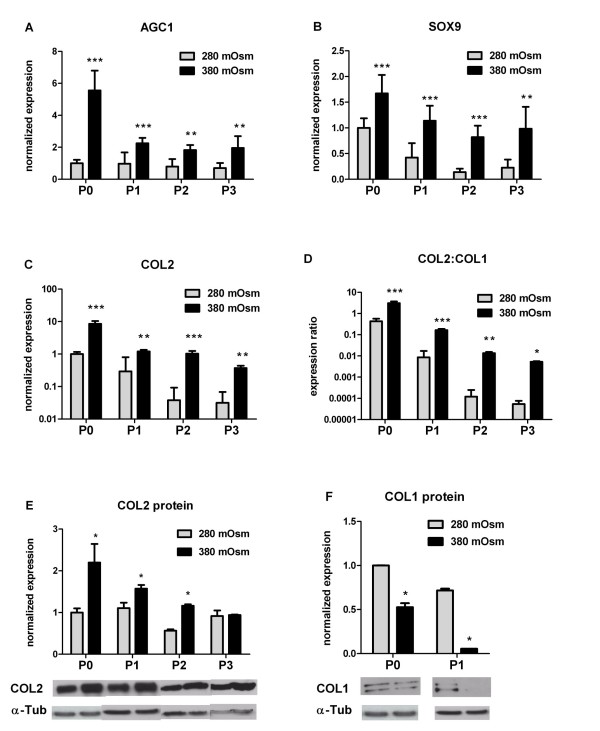
Hypertonic isolation and expansion increased marker gene expression in osteoarthritis human articular chondrocytes. Relative expression of (a) AGC1, (b) SOX9, (c) COL2 and (d) COL2:COL1 ratio in primary (P0) and passaged (P1 to P3) chondrocytes cultured at 380 mOsm compared with 280 mOsm. (e) COL2 protein expression and (f) COL1 protein expression in P0 and P1 osteoarthritis human articular chondrocytes. Protein levels normalized to α-tubulin. Data are mean ± standard deviation, n = 12. Differences from cells cultured at 280 mOsm are indicated: *P < 0.05, **P < 0.01 and ***P < 0.001.

