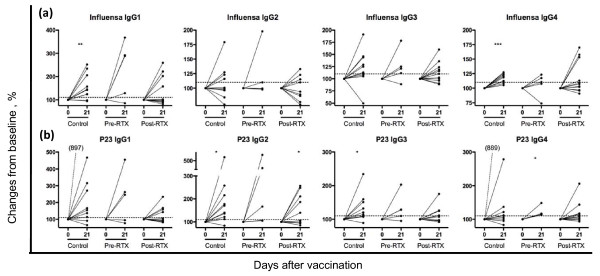
Figure 1.
Changes in IgG subclasses after protein and polysaccharide vaccination in rheumatoid arthritis (RA) patients before and after RTX treatment. (a) Changes at day 21 as compared with day 0 in immunoglobulin G (IgG)1-4 are shown after influenza vaccination. (b) Changes at day 21 as compared with day 0 in IgG1-4 after P23 vaccination. In all figure parts, day 0 levels are set at 100%, and day 21 indicates changes relative to day 0. Dotted line indicates cutoff, set at 110%. Each dot corresponds to one patient, and statistical evaluation was performed by using the paired t test; statistical significance is set at P < 0.05. *P < 0.05; **P < 0.01; ***P < 0.0001.

