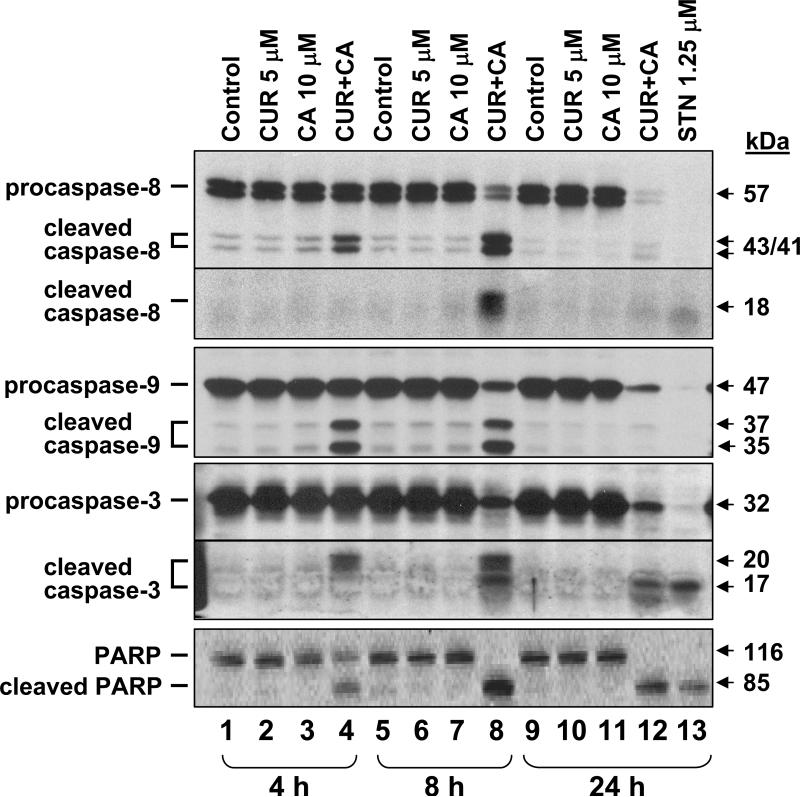
Fig. 8. Time-course of caspase-8, -9, and -3 and PARP processing in CUR/CA-treated cells.
HL-60 cells were incubated with 5 μM CUR and/or 10 μM CA for the indicated times followed by Western blotting of whole cell extracts. Staurosporin (STN, 1.25 μM) was used as the positive control. Each blot is a representative of 3 similar blots.

