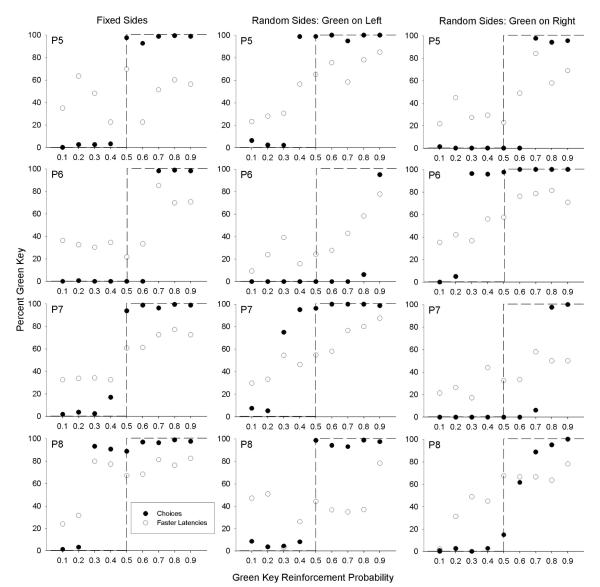
Figure 4.
The percentage of choice responses for the green key (filled circles) and the percentage of forced-trial response latencies that were faster for the green key (open circles) are shown for each pigeon in Experiment 2. The data from the conditions with random side locations are divided into trials with the green key on the left (center column) and on the right (right column). See text for details about the calculation of the latency percentages.

