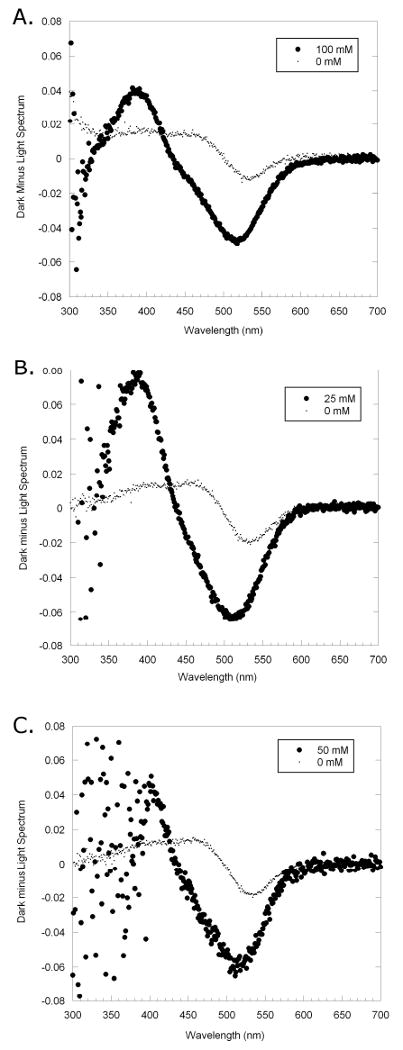
Figure 3.

Experimental results of extra MII stabilization. The dark spectrum from the UV/Vis scan was subtracted from the spectrum taken after the rhodopsin was exposed to light. Compounds: A. 3 (100mM), B. 4 (25mM), C. 5 (50mM) are shown. The light gray trace shows the MII stabilization and MI depletion with no compound, and the dark trace shows MII stabilization and MI depletion when compound is present. In this test, there is a large difference between MII stabilization in the sample containing the compound versus the sample with no compound.
