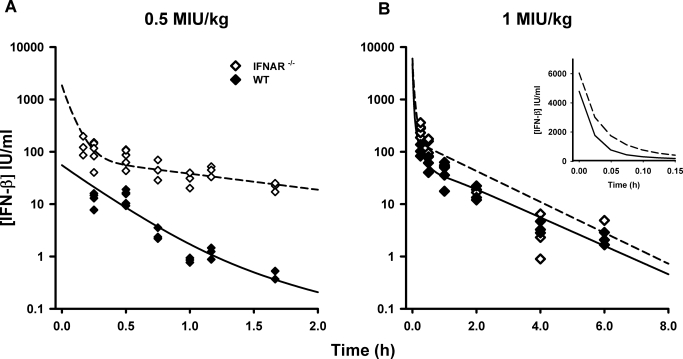
Fig. 2.
Concentration-time profiles for murine IFN-β administered intravenously in WT and IFNAR-1 KO mice. Symbols are concentrations from individual mice, and the lines are model-fitted profiles for the 0.5 (A) and 1 MIU/kg (B) doses. Inset panel shows model-predictions for the 1 MIU/kg dose at early time points.

