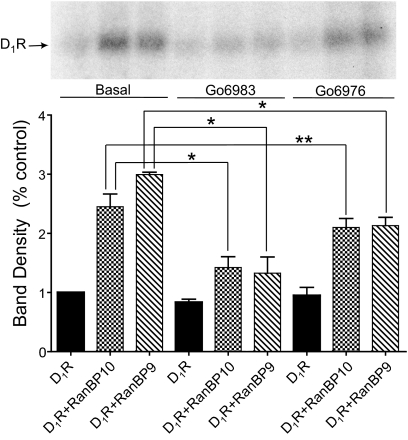
Fig. 12.
The RanBP9 and RanBP10-induced increase of D1 receptor phosphorylation is blocked by PKC inhibitors. HEK293T cells expressing the D1 receptor, D1 receptor + RanBP10, and D1 receptor + RanBP9 were treated with the PKC inhibitors Gö6983 (10 μM) or Gö6976 (10 μM) for 60 min followed by the assessment of basal phosphorylation using an in situ phosphorylation assay as described in Fig. 11. Top, autoradiogram of D1 receptor immunoprecipitates from a representative in situ phosphorylation assay. The lanes in the gel correspond to the bars at the bottom. Bottom, average values of band densities for each condition. The data are normalized as the percentage of control for each individual experiment. The histograms represent the mean ± S.E.M. from three independent experiments (analysis of variance followed by Bonferroni pair-wise comparisons; ∗, p < 0.05, ∗∗, p = 0.056).

