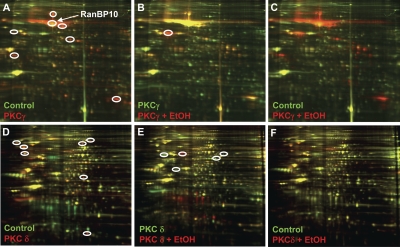
Fig. 2.
Identification of candidate PKC-interacting proteins. Each CyDYE-labeled PKC sample was simultaneously separated on a 2D-gel and scanned at specific wavelengths to reveal each of the CyDYE signals. Overlay of images reveal protein spots that are presumably specific (or nonspecific) to a given sample. Circled, protein spots selected for identification by mass spectrometry. A to C, PKCγ; D to F, PKCδ.

