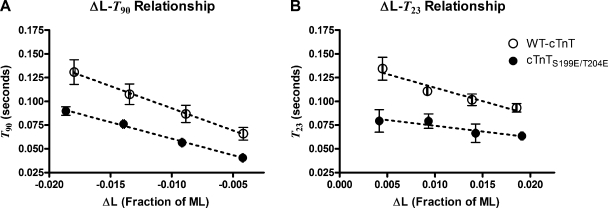
Figure 4.
Time to selected features of response waveforms as they varied with amplitude of the stretch, ΔL. Open symbols are data from muscle fiber bundles containing WT-cTnT; filled symbols are data from muscle fiber bundles containing cTnTS199E/T204E. (A) The time, T90, taken to recover 90% of the difference between F1 and FSS in responses to quick releases. (B) The time, T23, to nadir in responses to quick stretches. Dashed lines represent trend lines, and error bars are SEM. If the muscle bundle behaved as a linear system, neither T23 nor T90 would show any dependence on ΔL. Both T23 and T90 change with the magnitude of ΔL, indicating nonlinear behavior.

