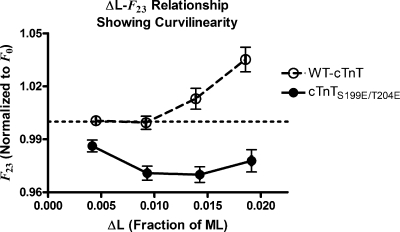
Figure 5.
The value of the force at the nadir in the response to quick stretches, F23, as it varied with amplitude of the stretch, ΔL. Open points and dashed line are data from muscle fiber bundles containing WT-cTnT; solid points and line are data from muscle fiber bundles containing cTnTS199E/T204E. The dashed horizontal line represents the steady-state force value before stretch (F0), normalized to 1. Error bars are SEM. Curvilinearity in this relationship in both groups of muscle fiber bundles is evidence of dynamic nonlinearity. This nonlinearity is exhibited differently in the two groups of muscle fiber bundles.

