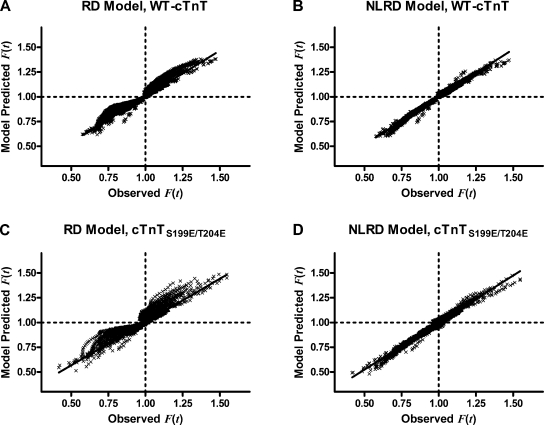
Figure 8.
Relationship between observed F(t) and model-predicted F(t). The relationship between observed F(t) and RD-predicted F(t) values is nearly linear from cardiac muscle fiber bundles containing either WT-cTnT (A) or cTnTS199E/T204E (C). Adding the nonlinear interaction term makes the trend between observed F(t) and NLRD-predicted F(t) more linear when fit to data from muscle fiber bundles containing either WT-cTnT (B) or cTnTS199E/T204E (D). The NLRD model resulted in regression slope (m) and R2 values closer to 1 and regression intercept (b) values closer to 0 than the RD model did.

