Figure 5.
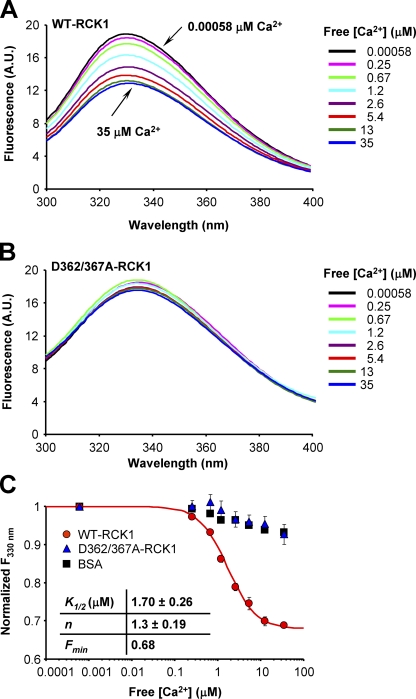
Tryptophan fluorescence reports WT- and D362/367A-RCK1 Ca2+ sensitivity. The intrinsic steady-state tryptophan fluorescence emission spectra of (A) WT and (B) D362/367A RCK1 recorded in increasing free [Ca2+]. As free [Ca2+] increases, the fluorescence intensity of WT-RCK1 decreases (A), whereas the fluorescence emission of D362/367A (B) shows no significant sensitivity to [Ca2+]. (C) The normalized fluorescence intensity at λ330nm and free [Ca2+] = 0.00058 µM, plotted against free [Ca2+] for WT-RCK1 (red circles), D362/367A-RCK1 (blue triangles), and albumin (BSA) (black squares). The continuous curve is the least-squares fit to a Hill function, the parameters of which are shown in the panel. Errors represent standard errors of the mean.

