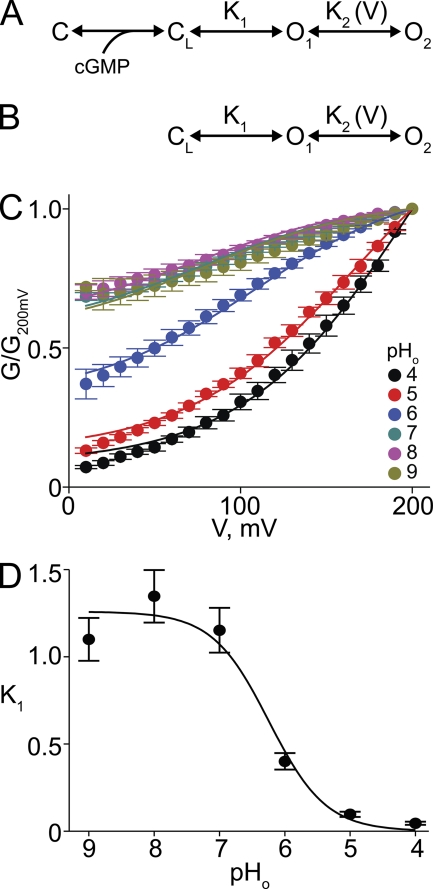
Figure 11.
Analysis of voltage gating produced by lowering pHo. (A and B) Schemes representing gating of the CNGA1 channel, in which C and CL represent closed channel states without and with cGMP bound, respectively, whereas O1 and O2 are two sequential open states in voltage-sensitive equilibrium. (C) Normalized G-V relations (mean ± SEM; n = 5) between 10 and 200 mV for CNGA1 channels at the indicated pHo. Curves correspond to a simultaneous fit of Eq. 2 to all datasets with K2 and ZK2 common to all curves. Best-fit parameters were (common) K2 = 0.38 ± 0.10 and ZK2 = 0.52 ± 0.03, and individual K1 values at each pHo (listed in Table I). (D) K1 plotted against pHo. Curve is a fit of a binding isotherm yielding apparent pKa = 6.2 ± 0.4.

