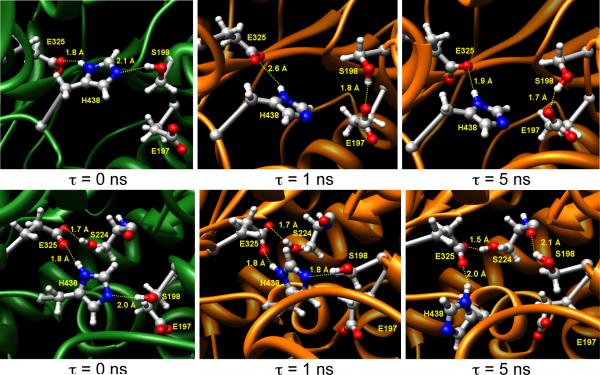
Figure 1.
Orientations of the catalytic triad and its surroundings for different time points during the two independent MD simulation trajectories for wild-type BuChE. In these figures, τ = 0 ns is the time when the temperature of the system has been raised from 0 to 300K, and then atoms were allowed to relax. Therefore the upper and lower left panels do not have the same initial geometry at τ = 0 ns.

