Abstract
Keratocytes of the corneal stroma produce transparent extracellular matrix devoid of hyaluronan (HA); however, in corneal pathologies and wounds, HA is abundant. We previously showed primary keratocytes cultured under serum-free conditions to secrete matrix similar to that of normal stroma, but serum and transforming growth factor β (TGFβ) induced secretion of fibrotic matrix components, including HA. This study found HA secretion by primary bovine keratocytes to increase rapidly in response to TGFβ, reaching a maximum in 12 h and then decreasing to <5% of the maximum by 48 h. Cell-free biosynthesis of HA by cell extracts also exhibited a transient peak at 12 h after TGFβ treatment. mRNA for hyaluronan synthase enzymes HAS1 and HAS2 increased >10- and >50-fold, respectively, in 4–6 h, decreasing to near original levels after 24–48 h. Small interfering RNA against HAS2 inhibited the transient increase of HAS2 mRNA and completely blocked HA induction, but small interfering RNA to HAS1 had no effect on HA secretion. HAS2 mRNA was induced by a variety of mitogens, and TGFβ acted synergistically to induce HAS2 by as much as 150-fold. In addition to HA synthesis, treatment with TGFβ induced degradation of fluorescein-HA added to culture medium. These results show HA secretion by keratocytes to be initiated by a rapid transient increase in the HAS2 mRNA pool. The very rapid induction of HA expression in keratocytes suggests a functional role of this molecule in the fibrotic response of keratocytes to wound healing.
Hyaluronan (HA)2 is a high molecular weight, nonsulfated glycosaminoglycan abundant in most tissues, where it acts as a hydrating agent and an organizer of extracellular matrix scaffolding via specific interactions with matrix proteins containing hyaluronectin domains (for review see Ref. 1). The corneal stroma, unlike most vertebrate tissues, is virtually devoid of HA. During active corneal wound healing and in corneas with various chronic pathologies, however, hyaluronan becomes abundant in the corneal stroma (2, 3).
The corneal stroma maintains transparency to light by virtue of the highly organized structure of its collagenous extracellular matrix. Collagen fibrils of the stroma exhibit highly regular parallel alignment and spacing. This spacing is controlled by collagen-associated small leucine-rich proteoglycans that form glycosaminoglycan cross-links between adjacent fibrils (4). Disruption of the fibril spacing is a major cause of loss of corneal transparency in scarring and stromal pathological conditions (5). In scars, interfibrillar glycosaminoglycan cross-links are altered or eliminated, and spaces without fibrils, known as “lakes,” have been identified (5). The almost ubiquitous presence of HA in nontransparent corneas suggests a relationship between the large hydrodynamic volume occupied by HA molecules and the disruption of the stromal ultrastructure. Additionally, the recent recognition of the diverse bioactivity of HA (6) raises the potential that matrix production by stromal keratocytes may be altered as a response to the HA present in pathological tissues. We have therefore undertaken a study to define the molecular mechanism by which HA is produced in the corneal stroma.
The stroma is populated by keratocytes, mesenchymal cells of neural crest origin. In vitro, keratocytes under quiescent serum-free conditions secrete matrix components similar or identical to those they produce in vivo (7–9). On exposure to serum and TGFβ, keratocytes alter their morphology and matrix secretion in a manner similar to cells in healing stromal wounds (8, 10). Expression of keratocan, a unique stromal keratan sulfate proteoglycan, is strongly down-regulated and that of biglycan, a dermatan sulfate proteoglycan not normally present in stroma, is increased markedly (10). The glycosaminoglycans also change in a manner similar to that seen in scar tissue (8). Secretion of sulfated keratan sulfate is reduced, and dermatan sulfate made by these cells is more highly sulfated and more abundant (10). HA is also up-regulated in this in vitro model of fibrosis (8). HA biosynthesis is not detected when keratocytes are cultured in serum-free medium, but after 6 days of exposure to FBS, HA rises to about 1% of the total glycosaminoglycan, increasing to about 5% in the presence of both TGFβ and serum (8).
Recent studies have shown HA in mammalian cells to be the product of an enzyme known as hyaluronan synthase (HAS) of which there are three isoforms (HAS1, HAS2, and HAS3). Each isoform is the product of a separate gene (11, 12). In several cellular systems, alteration in HA biosynthesis is correlated with increases in HAS mRNA pools, although the genes involved differ for different cell types (13–19). In this study we examined the temporal response of HA and HAS mRNA to activation of keratocytes with TGFβ and mitogens. We found a rapid increase in HA biosynthesis resulting from increases in mRNA pools of the HAS2 gene. This mRNA undergoes a rapid and transient response, peaking at 4–6 h after stimulation and returning to near base line within 24 h. HA biosynthesis also increases rapidly, peaking at 12 h and decreasing thereafter.
EXPERIMENTAL PROCEDURES
Cell Culture
Corneal stromas from fresh bovine eyes (Pel-Freez Biologicals, Rogers, AR) were digested with collagenase as described previously (9). The cells were diluted in serum-free DME/F12 medium containing antibiotics and cultured on tissue culture-treated plastic at 4 × 10⁴ cells/cm2 in a humidified atmosphere containing 5% CO2. Myofibroblastic transformation was induced by the addition of the same medium containing 2% FBS and 1 ng/ml recombinant human TGFβ1 (Sigma). Heparin-stripped horse serum was prepared as described previously (20).
Quantification of Glycosaminoglycans Using FACE
Glycosaminoglycans and proteoglycans were isolated from the culture medium of three identical 75-cm2 flasks using ion exchange chromatography as described previously (10). Chondroitin/dermatan sulfate and hyaluronan were digested with chondroitinase ABC (catalog number C3667, Sigma), 0.2 units/ml for 16 h at 37 °C in 0.1 m NH4 acetate, pH 7.5. Digested products were recovered by ultrafiltration through Microcon YM-3 microfiltration devices (Millipore). Mannose was added to aliquots of the digestion products as an internal standard, and the carbohydrates were fluorescently labeled with 5 µl of 0.1 m 2-aminoacridone in 3:17 (v/v) acetic acid/dimethyl sulfoxide for 15 min followed by addition of 5 µl of freshly dissolved 1 m sodium cyanoborohydride at 37 °C overnight (21). Borohydride was quenched with 30 µl of 25% glycerol containing 2 µl of 1 mg/ml bromphenol blue, and the derivatized disaccharides were separated on 8 × 10 × 0.05-cm gels of 27% acrylamide, 0.72% bisacrylamide containing 0.045 m Tris acetate, pH 7, and 0.25% glycerol. The running buffer was 0.089 m Tris borate, 2 mm EDTA, pH 8.3, chilled to 4 °C. Electrophoresis was carried out on ice at 8 watts of constant power per gel. Fluorescent bands were immediately photographed using a 12-bit Bio-Rad FluorS Max imaging system, and quantification was accomplished with Bio-Rad Quantity One software. FACE bands generated by chondroitinase were identified by co-electrophoresis with purified standards of fragments from chondroitin sulfate and hyaluronan (Sigma).
HA was also quantified directly in conditioned culture medium using a competitive ELISA based on HA binding to biotinylated HABP (Echelon Biosystems Inc., Salt Lake City, UT). 100 µl of each culture medium was assayed in triplicate using a standard curve of HA according to the manufacturer’s directions.
HA Biosynthesis by Keratocytes
Primary bovine keratocytes were seeded at 1 × 10⁶/well on FNC (Athena Environmental Service, Inc.) pre-coated 6-well plates in serum-free DME/F12 medium. Fibroblastic response was induced with 2% FBS and 1 ng/ml TGF-β1 in DME/F12 for 6, 12, 18, 24, and 48 h, respectively. The control was incubated in serum-free DME/F12. During the last 6 h of incubation, [3H]glucosamine (38.3 Ci/mmol; PerkinElmer Life Sciences) was added to the medium to a final concentration of 50 µCi/ml. After labeling, the medium was collected; the cells were rinsed twice with cold PBS. The wash and medium were combined, and glycosaminoglycans in the culture medium were purified by ion exchange chromatography, dialyzed against water, and lyophilized. The dried samples were dissolved in 60 µl of 0.02 m sodium acetate buffer, pH 6.0, containing 0.15 m NaCl. HA was captured on wells of a microtiter plate coated with hyaluronan-binding protein (HABP) (Corgenix Inc.). To confirm the captured radioactivity as radiolabeled HA, one-half of each sample was digested by 1 TRU/µl Streptomyces hyaluronidase (Sigma) at 50 °C overnight before adsorption by HABP. Triplicate 100-µl samples were added into a 96-well HABP-coated plate and incubated at room temperature overnight followed by four washes with PBS. The bound HA was released by digestion with 25 µg/ml proteinase K in 0.1% SDS and 0.1 m Tris-HCl, pH 7.4, at 37 °C for 2 h. The solution was transferred to scintillation vials, and the incorporation of [3H]GlcNAc into HA was determined as disintegrations/min (dpm) using a Beckman Coulter LS 3801 after the addition and complete emulsion of the samples in 4 ml of Scintisafe (Fisher) scintillant.
Membrane Preparation
Primary bovine keratocytes in DME/F12 were first seeded at 3–6 × 10⁶ cells/150 cm2 on collagen-coated culture dishes in serum-free DME/F12 for 48 h and then were induced with 2% FBS and 1 ng/ml TGFβ1 in DME/F12 for variable times. After induction, the cells were washed, harvested in cold PBS, and centrifuged at 2000 × g for 10 min. The cell pellets were resuspended in cold hypotonic homogenization buffer, containing 10 mm HEPES, pH 7.5, 1.5 mm MgCl2, 10 mm KCl, 1 mm NaF, 1 mm sodium vanadate, 5 µl/ml protease inhibitor mixture (catalog number P8340, Sigma). After swelling on ice for 10 min, the cells were disrupted by sonication, and nuclei were pelleted by centrifugation at 4000 × g for 10 min. The supernatants containing crude membranes were centrifuged in a Beckman TLA100.2 rotor at 80,000 × g for 50 min. The membrane pellet was resuspended using homogenization buffer and centrifuged again at 80,000 × g for 30 min. The washed membrane pellets were resuspended in 100 µl of 15% glycerol, 50 mm Tris-HCl, pH 7.4, 20 mm MgCl2, 1 mm EGTA and stored at −80 °C until use. The membrane protein concentration was measured by fluorescence using Nano-Orange reagent (Invitrogen).
In Vitro HA Synthase Activity
To measure HA polymerization, 0.1 mm unlabeled UDP-GlcNAc, 2.2 µm 3H-labeled UDP-GlcNAc (60 Ci/mmol; American Radiolabeled Chemicals Inc.), 0.5 mm UDP-GlcUA, and 1 mm dithiothreitol were added to 10 µg of the membrane protein in a total of 50 µl. One-half of each sample was incubated for 4 h at 37 °C, and the reactions were then terminated by boiling the mixture for 10 min. The second part was boiled for 10 min first and then subjected to incubation at 37 °C for 4 h. HA production was captured by using an HABP plate as described above. Captured HA was released by proteinase K. The solution was transferred to scintillation vials, and the incorporation of [3H]UDP-GlcNAc into HA was determined as disintegrations/min using a Beckman Coulter LS 3801.
Degradation of Fluorescein-labeled HA
Fluorescein-HA (Sigma) was isolated by initial chromatography on a Superose 6 gel size exclusion column, eluted in 0.02 m Tris, pH 7.4, 0.2 m NaCl. High molecular weight fractions were pooled, dialyzed against distilled water, dried, and dissolved in DME/F12, filter-sterilized, and stored at −20 °C until use.
Primary bovine keratocytes in DME/F12 were seeded at 1 × 10⁵ cells/well on FNC pre-coated 6-well plates and induced with 2% FBS and 1 ng/ml TGFβ1 in DME/F12 for 3 days. Control cells were plated at 1 × 10⁶ cells/well in serum-free DME/F12. Three days later, 7.5 µg/ml fluorescein HA was added to each well and incubated at 37 °C for 24 h. The medium was collected, and glycosaminoglycans in the culture medium were purified by ion exchange chromatography and subjected to size exclusion chromatography on Superose 6 gel using the conditions described above. The fluorescence of the fractions was measured by FLx800 Reader (Bio-Tek Instruments).
mRNA Quantification
Cells were collected by centrifugation after scraping into cold saline, and RNA was isolated using RNeasy Mini kit (Qiagen). RNA was treated with DNase I (Ambion) according to the supplier’s protocol. RNA (400 ng) was transcribed to cDNA in a 100-µl reaction containing 1×PCR II buffer (Roche Applied Science), 1.5 mm MgCl2, 800 µm dNTP mixture (Roche Applied Science), 2.5 µm random hexamers (Invitrogen), 0.4 units of RNase inhibitor, and 125 units of SuperScript II reverse transcriptase (Invitrogen). qRT-PCR was carried out for 45 cycles of 15 s at 95 °C, 60 s at 60 °C after an initial incubation at 95 °C for 10 min in an ABI 7700 thermocycler. Reaction volume was 25 µl containing 1× TaqMan reaction buffer (Applied Biosystems), primers, probe, and cDNA. Forward and reverse primers and fluorescent internal hybridization probes for each gene, as shown in Table 1, were used at optimized concentrations. Efficiency of the amplification was determined to be >90% in each case.
TABLE 1.
Primers and siRNA
| Gene | Primer | Sequence |
|---|---|---|
| HAS1 | Forward | AGGCCTGGTACAACCAGAAG |
| Reverse | TCTCCGAGTAGCAGCGAGAC | |
| Taqman probe |
FAM-AGCATGGGCTATGCCACCAAGTACAC-TAMRA | |
| siRNA 1 | GUGCUGCTCTCACUCUAUA | |
| siRNA 2 | GGAACAACCUCCUGCAGCA | |
| siRNA 3 | GCGAGUGGCUGUACAAUGC | |
| siRNA 4 | ACGCGUGGAUGACCUACGA | |
| HAS2 | Forward | CCGTCATCACTGGGTTCTTC |
| Reverse | TAAGGCAGCTGGCAAAAGAT | |
| Taqman probe |
FAM-TCATTGCCACGGTAATCCAGCTCTTC-TAMRA | |
| siRNA | CCUUGGAAUCACAGCUGCUUAUAUU | |
| HAS3 | Forward | CCAACCGAGTCCTGAGTCTT |
| Reverse | TGTATGACCGTGGCAATGAG | |
| Taqman probe |
FAM-CTCCCGGAAGTAAGACTTGCTCCAGC-TAMRA |
For each gene/cDNA combination, amplifications without reverse transcriptase were carried out as negative controls. Amplification of 18 S ribosomal RNA was carried out for each cDNA (in triplicate) for normalization of RNA content. Threshold cycle number (Ct) of amplification in each sample was determined by ABI software. Relative mRNA abundance was calculated as the Ct for amplification of a gene-specific cDNA minus average Ct for 18 S, expressed as a power of 2, i.e. 2−ΔCt. Three individual gene-specific values, thus calculated, were averaged to obtain standard errors.
Gene Knockdown Using siRNA
Uncultured primary cells at a concentration of 2.5 × 10⁶ cells/ml in siPORT electroporation buffer (Ambion Inc.) were transfected with 21-bp double-stranded siRNA. For HAS1 mRNA a mixture of four siRNAs was used (Smart Pool, Dharmacon), and for HAS2 a single 21-bp chemically modified siRNA (Stealth RNA, Invitrogen) was transfected at 1 µm final concentration using electroporation with an ECM830 Square Wave electroporator (BTX Inc., San Diego) with three pulses of 3500 V/cm, each pulse having a duration of 300 µs with a delay of 125 ms between pulses. The cells were plated at 8 × 10⁴ cells/cm2 in serum-free medium on tissue culture plastic, precoated with FNC coating mixture. After 24 h, cells were treated with 2% FBS and 1 ng/ml TGFβ for 6 h, and RNA was prepared for qRT-PCR analysis. For analysis of HA secretion, conditioned medium was collected from 24 to 72 h after electroporation as a negative control. At 72 h the medium was changed to 2% FBS, 1 ng/ml TGFβ. After 48 h this medium was collected for analysis of HA by FACE gels.
RESULTS
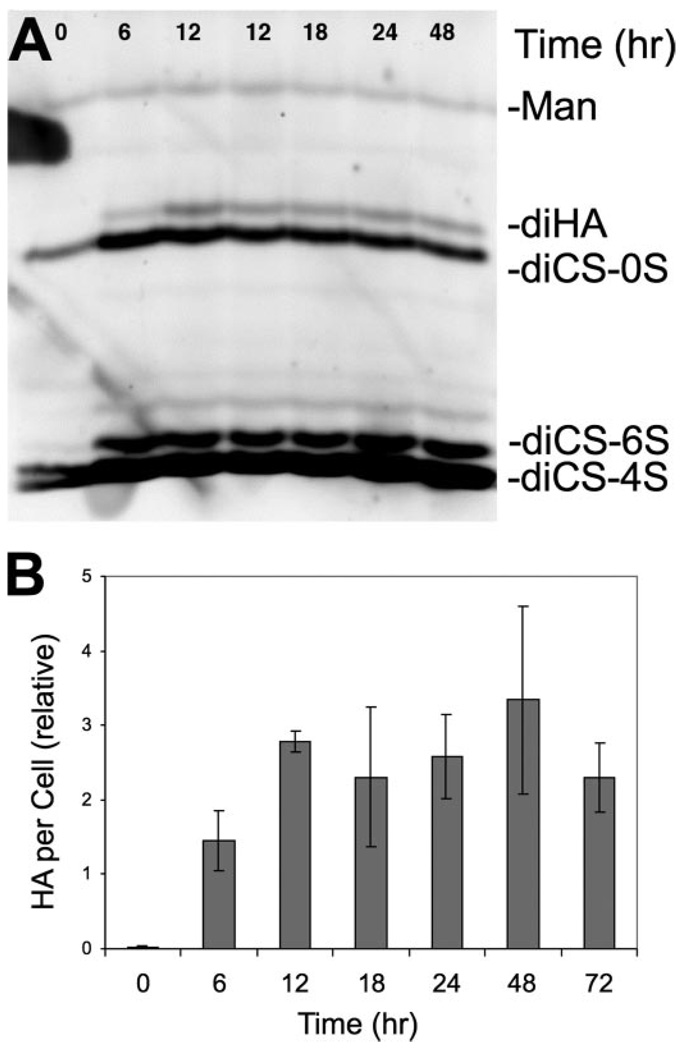
We previously reported HA secretion by quiescent primary cultures of bovine keratocytes to increase from undetectable levels to 5% of the total glycosaminoglycan 6 days after induction of myofibroblastic transdifferentiation with FBS and TGFβ. In this study we initially examined the kinetics of induction of the HA using FACE gel technology. As shown in Fig. 1A, the HA disaccharide (diHA) band could be detected within 6 h of exposure to FBS + TGFβ1, and its abundance increased after 12 h in the induction medium. Disaccharides containing 6-sulfate from chondroitin-dermatan sulfate (diCS-6S) also increased rapidly; however, total chondroitin/dermatan sulfate did not change for at least 24 h of treatment. Quantification of the HA from FACE analysis similar to that shown in Fig. 1A is presented in Fig. 1B. The HA recovered from culture medium increased at both 6 and 12 h of FBS + TGFβ treatment, after which the HA level remained statistically unchanged for at least 72 h.
FIGURE 1. Stimulation of HA secretion by TGFβ and FBS.
Primary keratocyte cultures were exposed to 2% FBS and 1 ng/ml TGFβ for different lengths of time, and proteoglycans were isolated from conditioned medium and digested with chondroitinase as described under “Experimental Procedures.” Disaccharides from HA and chondroitin/dermatan sulfate were analyzed by FACE. A, gel image illustrating the marked increase in HA during the first 12 h of exposure to FBS and TGFβ. B, quantitative analysis of the HA bands in this experiment carried out on triplicate samples normalized to the mannose internal standards (Man). The disaccharides used are as follows: diHA, hyaluronan disaccharide; diCS-0S, nonsulfated chondroitin sulfate disaccharide; diCS-6S, chondroitin sulfate disaccharide GlcNAC-6 sulfate; diCS-4S, chondroitin sulfate disaccharide GlcNAC-4 sulfate.
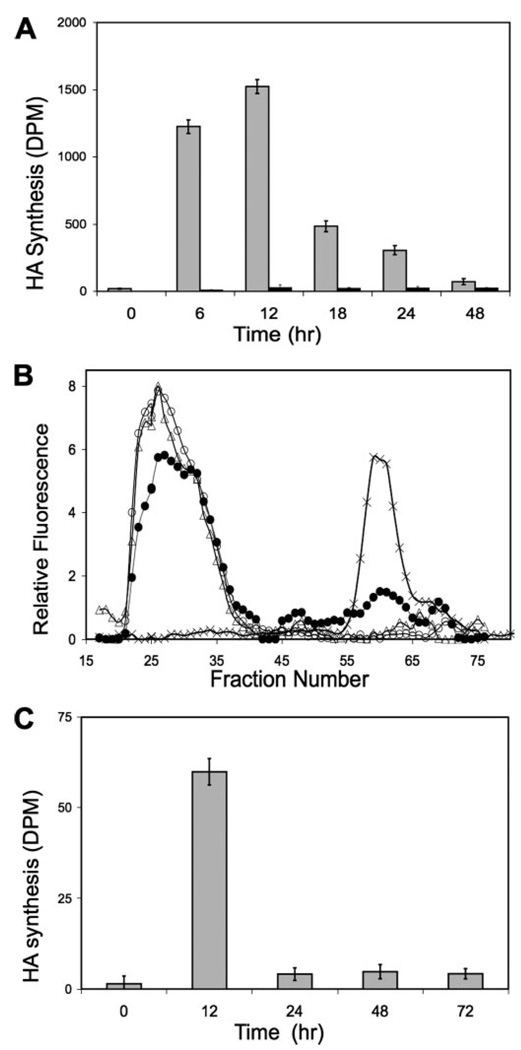
This plateau in HA accumulation suggests a decrease in the biosynthetic rate and/or increased degradation occurring after 12 h of TGFβ exposure. Alterations in HA biosynthesis and degradation are explored in the experiments shown in Fig. 2. In Fig. 2A, secreted HA was recovered from culture medium after 6 h of metabolic labeling with [3H]glucosamine. Incorporation during the 6-h labeling period was minimal without TGFβ treatment, but after exposure to TGFβ, 3H-labeled HA increased markedly at 6 h, reaching a peak at 12 h of incorporation, ration exhibiting a 75-fold increase compared with the untreated cultures. After 12 h, incorporation decreased rapidly. By 24 h metabolic labeling of the HA was about 3-fold that of untreated controls. By 48 h the rate had decreased to only 5% of the maximum rate but still remained about 2-fold that of the control.
FIGURE 2. Rate of HA synthesis in response to TGFβ and FBS.
A, primary keratocytes were stimulated with TGFβ and FBS for variable lengths of time as in Fig. 1. [3H]Glucosamine was added during the final 6 h of culture, and proteoglycans were recovered from the culture medium by ion exchange as described under “Experimental Procedures.” HA was captured by immobilized HABP before (gray bars) or after treatment with hyaluronidase (white bars) as described under “Experimental Procedures.” Data are expressed in terms of radioactivity (DPM) of HA per 106 cells. B, degradation of exogenous HA by keratocytes. High molecular weight fluorescein-labeled HA was added to keratocyte cultures at a concentration of 7.5 µg/ml for 24 h and then recovered from the culture medium by ion exchange chromatography. Samples of the starting material (triangles) were compared with HA incubated with keratocytes in serum-free medium (open circles) or with keratocytes after treatment with FBS and TGFβ for 48 h (filled circles), or hyaluronidase-digested HA (crosses) on Superose-6 size exclusion chromatography. Fluorescence values are normalized to those of the control. C, cell-free HA biosynthesis. Membrane preparations from keratocyte cultures treated for various lengths of time with FBS and TGFβ were used for cell-free biosynthesis of HA as described under “Experimental Procedures.” Bars show labeled HA synthesized in terms of disintegrations/min per µg of protein. Error bars show standard deviation of triplicate measurements.
Incorporation of label under the conditions in Fig. 2A represents a balance between biosynthesis and degradation. To explore the extent to which HA degradation contributed to the results of Fig. 2A, degradation of fluorescent HA added to culture medium was examined using size exclusion chromatography. As shown in Fig. 2B, HA exposed to quiescent keratocytes for 24 h was recovered quantitatively and showed no change in molecular size or release of small fragments. In cultures treated with FBS + TGFβ1, all of the added HA was recovered, but ~25% was degraded to smaller fragments. These results suggest that HA secreted during a 6-hour labeling period (as in Fig. 2A) would be expected to be recovered quantitatively and largely intact (94–100%). The changes in accumulation in HA observed in Fig. 2A, therefore, may be viewed as largely the result of alteration in HA biosynthesis with relatively minor contribution by catabolic action.
In Fig. 2C, membrane preparations from cells treated with FBS + TGFβ were used in a cell-free assay of HA biosynthesis. Cells treated for 12 h showed >40-fold stimulation over controls. At 24, 48, and 72 h of treatment the synthetic activity was maintained at ~3-fold of the control (p < 0.05). These results are consistent with those of Fig. 2A in support of the conclusion that TGFβ produces a transient induction of HA biosynthesis reaching a maximum within 12 h and decreasing thereafter to a level 2–3 times that of untreated cells.
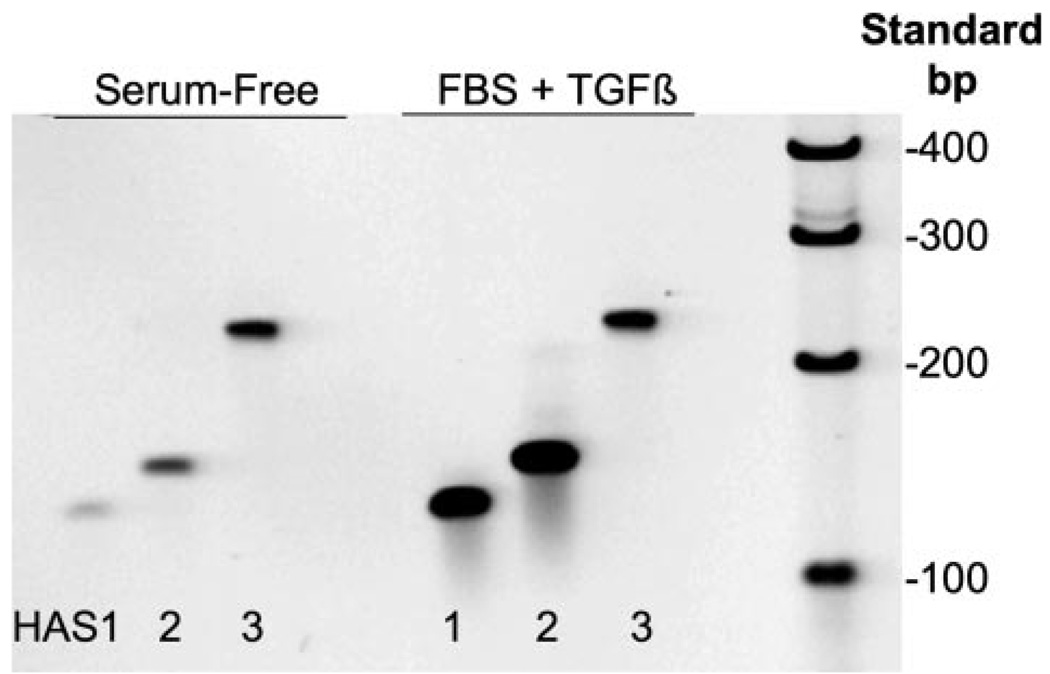
Three HAS genes have been described, and their expression varies with different tissues. To determine which might be expressed in keratocytes, cDNA from keratocyte cultures untreated and treated for 6 h with FBS + TGFβ1 was amplified using primers specific for each of three bovine HAS genes. As seen in Fig. 3, each of the primer sets amplified a single product of the expected length. Keratocytes therefore appear to express mRNA for all three of the HAS mammalian genes. In the TGFβ-treated cells, the bands for HAS1 and HAS2 were considerably stronger, suggesting an increase in mRNA pool size for these genes in response to TGFβ.
FIGURE 3. Detecting mRNA for hyaluronan synthase genes in keratocytes.
Total RNA was extracted from primary bovine keratocytes cultured in serum-free medium or treated for 6 h with FBS and TGFβ as in Fig. 1. RNA was reverse-transcribed using random primers, and DNA was amplified for 35 cycles using primers representing unique regions from bovine HAS1, 128 bp; HAS2, 134 bp; and HAS3, 234 bp (Table 1). The products were separated on 6% acrylamide gels and stained using SYBR Gold. Lane 7 shows DNA molecular size standards.
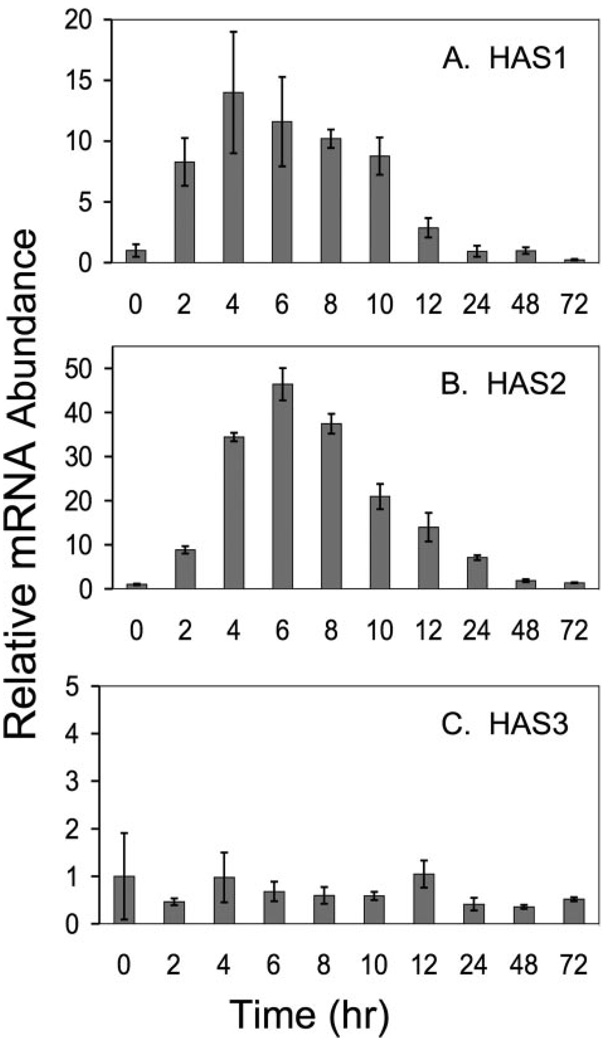
Quantitative RT-PCR assays were designed with the primers used in Fig. 3 to determine the changes of the HAS mRNA pools in response to FBS + TGFβ1. As shown in Fig. 4, HAS1 and HAS2 each exhibited a rapid increase after stimulation of the cells, reaching a maximum in 4–6 h. HAS3, however, showed no change in pool size over 72 h of treatment. HAS2 increased 30–50-fold under these conditions, whereas HAS1 increased about 10-fold. The pools of mRNA for both genes decreased rapidly after reaching maximum. HAS1, in fact, decreased to almost the same level as untreated cells within 24 h, whereas HAS2 was about 2-fold the original level after 48 h.
FIGURE 4. Temporal response of HAS mRNA to TGFβ.
Primary bovine keratocytes were exposed to FBS and TGFβ as in Fig. 1, for the intervals shown, and the total RNA was analyzed by qRT-PCR for each gene product compared with 18 S RNA in the same sample as described under “Experimental Procedures.” Bars show the standard error of triplicate analyses carried on duplicate cultures. For each gene, mRNA abundance at time 0 was set to 1.
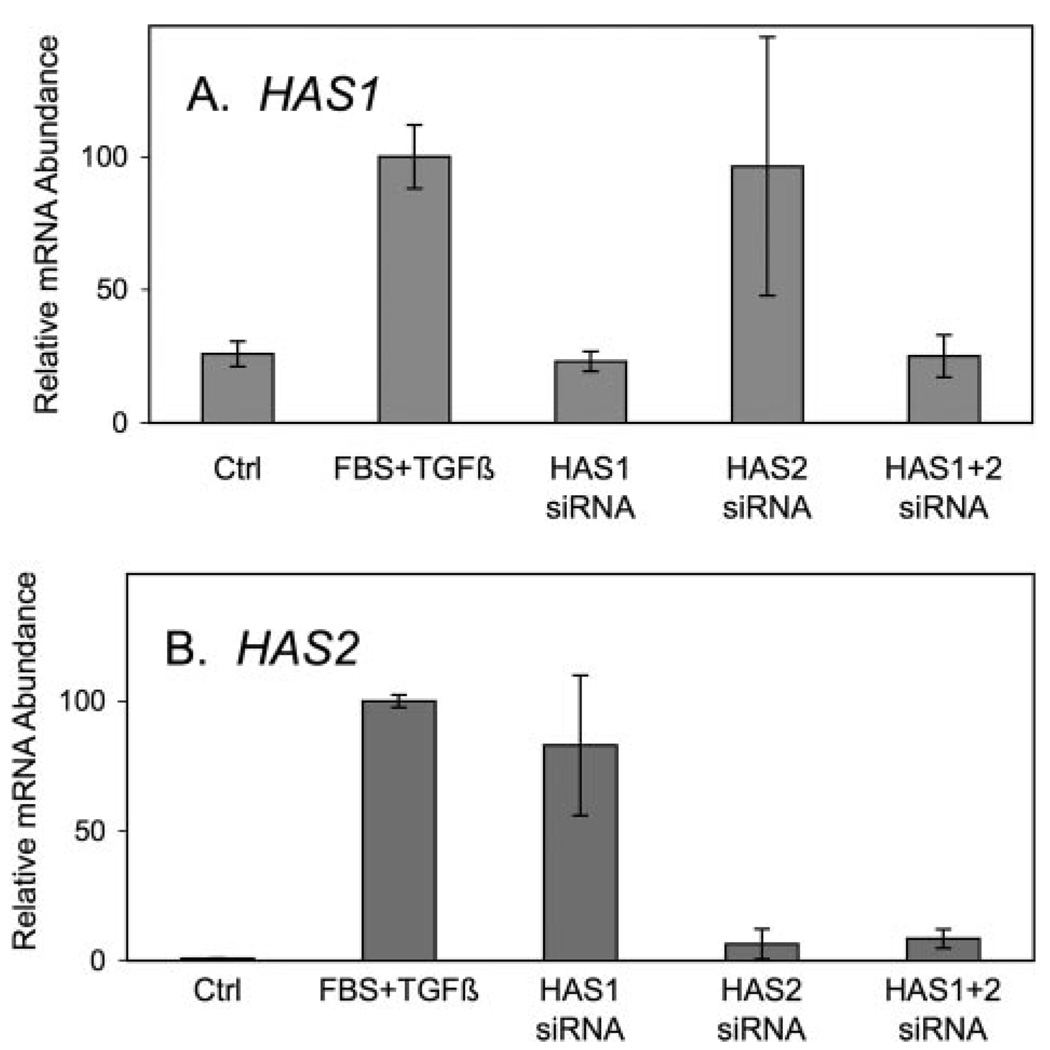
The very rapid increase in both mRNA pools and HA biosynthesis suggests a causal relationship. To test this relationship siRNA probes were designed for HAS1 and HAS2. As shown in Fig. 5, treatment of the keratocytes with HAS1 siRNA for 24 h before growth factor treatment completely blocked increases in HAS1 mRNA pools but had no effect on the increased pool of HAS2 transcripts. Conversely, siRNA with HAS2-specific sequence was able to block about 95% of the up-regulation of HAS2 mRNA but had no effect on the pool size of HAS1. Electroporation of a mixture of the two siRNAs completely blocked both HAS1 and HAS2 up-regulation.
FIGURE 5. Inhibition of HAS up-regulation by siRNA.
Primary uncultured keratocytes were transfected with siRNA for HAS1, HAS2, or a combination, and cultured for 20 h in serum-free conditions. HAS gene expression was induced with TGFβ and FBS for 6 h as in Fig. 1, and total cellular RNA was assayed for mRNA abundance of HAS1 (A) and HAS2 (B). mRNA levels are normalized so that the induced samples = 100. Error bars show triplicate analyses of RNA from three pooled cultures. Ctrl, control.
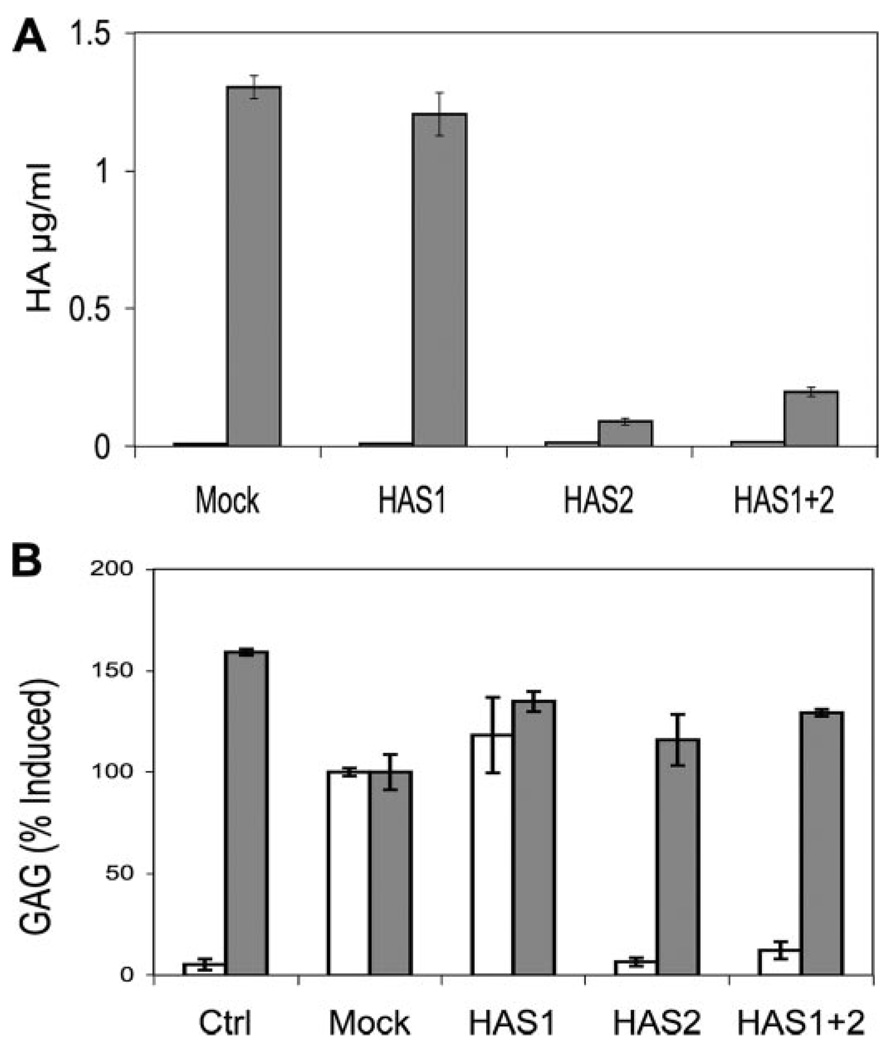
Secretion of HA by the keratocytes in the presence of the siRNA showed HA biosynthesis to be correlated only with HAS2 mRNA levels. In the experiment shown in Fig. 6A, HA was measured using an ELISA based on binding of HABP. HA in medium was determined both before and after induction of HA biosynthesis by FBS + TGFβ1. In each case the pre-induction levels of secreted HA were near the lower limits of detection (Fig. 6A, open bars on left.) After induction (Fig. 6A, gray bars), HAS1 siRNA transfection resulted in no statistically significant alteration in the HA amount compared with a mock transfection control. HAS2 siRNA, however, blocked the stimulation of HA secretion by about 93% (p < 0.01). A combination of siRNA to HAS1 and HAS2 in the same cultures reduced the HA secretion by 92% (p < 0.03).
FIGURE 6. Knockdown of HA biosynthesis by HAS2 siRNA.
Primary bovine keratocytes were transfected with siRNA against HAS1, HAS2, or a combination as described under “Experimental Procedures.” The cells were cultured in serum-free medium for 48 hand then exposed to FBS and TGFβ for 48 h. A, HA in serum-free medium (left, open bars) or TGFβ-FBS (right, gray bars) was analyzed by HABP-ELISA as described “Experimental Procedures.” B, chondroitin/dermatan sulfate (CS) (gray bars) and HA (open bars) were analyzed by FACE gels similar to those in Fig. 1. Ctrl (control) shows HA and CS expression in serum-free medium for 48 h. All other samples show expression during 48 h after induction with TGFβ-FBS. Mock indicates no siRNA. HA and chondroitin/dermatan sulfate values are normalized to the Mock samples. Bars show standard deviation of triplicate analyses.
In a similar experiment shown in Fig. 6B, HA and chondroitin sulfate secretion were measured by FACE. The diCS-0S band of chondroitin/dermatan sulfate (Fig. 6B, gray bars), measured on the same gel as the HA, showed no change as a result of HAS siRNA transfection, whereas HAS2 siRNA reduced the DiHA bands by >90%. These results show the specificity of the HAS2 siRNA in blocking only HA secretion and support the hypothesis that the up-regulation of HA biosynthesis by keratocytes in response to FBS + TGFβ1 stems directly from the rapid increase in HAS2 mRNA pool. HAS1 mRNA appears to play no role in this response.
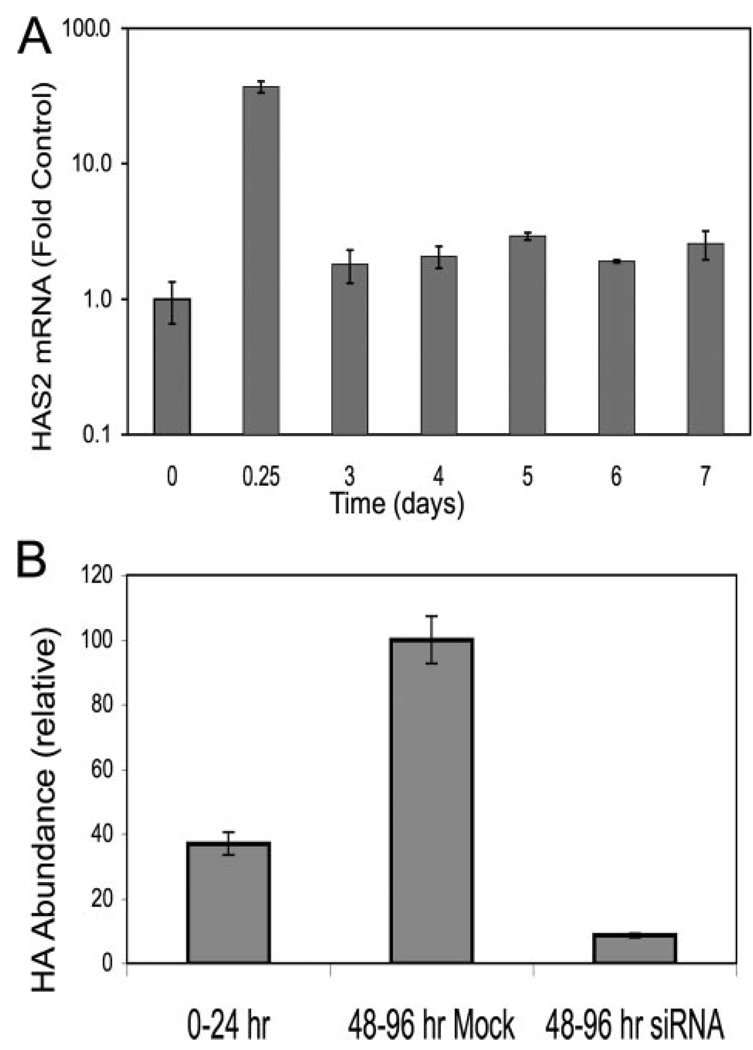
We previously found synthesis of HA to be up-regulated after 6 days of exposure to FBS + TGFβ1; however, the data in this study show a marked decrease in HAS mRNA and HA synthesis after 24 h. To understand the temporal expression patterns, HAS2 mRNA was examined for longer times. As seen in Fig. 7A, HAS2 mRNA pools after the initial transient peak remained slightly elevated (about 2-fold) compared with levels of the untreated controls for at least 7 days. To test if HAS2 was involved in continued HA biosynthesis, we transfected HAS2 siRNA into keratocytes 24 h after growth factor treatment, a time at which mRNA pools had stabilized at a lower level. As shown in Fig. 7B, HA secretion over the 48–96-h period was suppressed by about 65% by this treatment, suggesting continued secretion of HA to be the result of the slight (i.e. 2-fold) long term increase in HAS2.
FIGURE 7. Long term HA biosynthesis is HAS2-related.
A, primary bovine keratocytes were exposed to FBS and TGFβ similarly to Fig. 1 for the intervals shown, and the HAS2 mRNA was determined by qRT-PCR as described in Fig. 4. Bars show the standard error of triplicate analyses of duplicate cultures. RNA abundance is compared with untreated cells = 1. Note the log scale in the y axis. B, HA biosynthesis was induced in keratocytes for 24 h followed by transfection with siRNA against HAS2. Conditioned medium was collected for the period 24–72 h after siRNA transfection (48–96 h after TGFβ treatment). HA was determined in the collected media using FACE. Mock cells were subject to electroporation without siRNA.
Earlier we reported HA biosynthesis to be stimulated by FBS alone as well as with TGFβ. We pursued these observations in the experiment shown in Table 2, in which HAS2 transcript increase was determined in response to addition of a number of agents to the keratocytes in serum-free medium. As shown in Table 2, FBS, as well as purified mitogens such as insulin-like growth factor 1 (IGF1), platelet-derived growth factor BB (PDGF), fibroblast growth factor 2 (FGF2), and TGFβ alone, all stimulated HAS2 significantly. To our surprise, agents that have no mitotic activity in these cells such as lipid-rich bovine serum albumin and heparin-stripped horse serum also activated HAS2 by about the same degree as active mitogens. These stimulatory effects were not as strong as the combination of TGFβ and FBS together, suggesting a synergistic effect of TGFβ on increases in HAS2 transcripts.
TABLE 2.
Stimulation of HAS2 mRNA
| Culture condition | HAS2 | S.D. |
|---|---|---|
| Serum-free (control) | 1.0 | 0.2 |
| 2% FBS | 11.3 | 2.5 |
| 0.2 ng/ml TGFβ + 2% FBS | 38.4 | 11.8 |
| 1 ng/ml TGFβ + 2% FBS | 43.3 | 2.5 |
| 2 ng/ml TGFβ + 2% FBS | 25.1 | 4.4 |
| 10 ng/ml TGFβ + 2% FBS | 28.4 | 9.9 |
| 1 ng/ml TGFβ serum-free | 8.5 | 1.2 |
| IGF1 50 ng/ml serum-free | 9.0 | 0.6 |
| FGF2 10 ng/ml serum-free | 7.9 | 0.7 |
| PDGF BB 10 ng/ml serum-free | 23.8 | 1.5 |
| 1% Heparin-stripped horse serum | 10.8 | 2.7 |
| 3 mg/ml Bovine serum albumin | 16.7 | 4.8 |
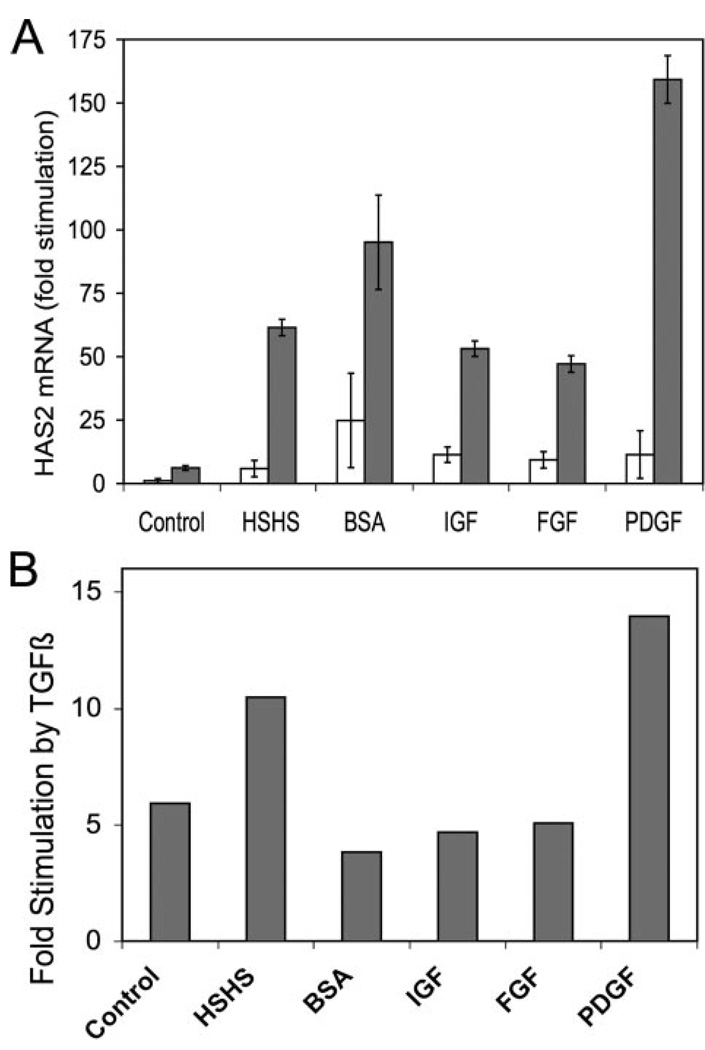
This synergy was further documented in Fig. 8. As seen in Fig. 8A, the increase in HAS2 levels in the presence of TGFβ was markedly stimulated (dark bars) beyond the level achieved using each of the agents tested alone (light bars). In Fig. 8B the degree of stimulation provided by TGFβ is displayed. In each case TGFβ stimulated HAS2 mRNA by 5–10-fold regardless of the original level. TGFβ stimulation of HAS2, therefore, is not an additive effect but multiplicative. Highest absolute levels of the HAS2 (about 150-fold over quiescent cells) were observed in the presence of TGFβ and PDGF.
FIGURE 8. Synergistic stimulation of HAS2 levels by TGFβ and mitogens.
A, primary bovine keratocytes were exposed to various agents as in Table 1 in the presence (dark bars) or absence (open bars) of 1 ng/ml TGFβ. HAS2 mRNA was determined by qRT-PCR after 6 h of exposure. Error bars show standard deviation of triplicate analyses. mRNA levels in untreated cells were set = 1. B, shows the ratio of mRNA abundance for samples in A (TGFβ treated/no TGFβ). HSHS, 2% heparin-stripped horse serum; BSA, 1 mg/ml Albumax, lipid-rich bovine serum albumin; IGF, 50 ng/ml insulin-like growth factor 1; FGF, 10 ng/ml fibroblast growth factor-2; PDGF, 10 ng/ml platelet-derived growth factor BB.
DISCUSSION
In this study we found HA biosynthesis by keratocytes to respond rapidly to TGFβ reaching a maximum rate of synthesis within 12 h. This increase in HA was preceded by a rapid and transient increase in HAS1 and HAS2 mRNA pools, peaking at 4–6 h and declining within 24–48 h to levels close to that of the quiescent cells. The increase in HAS2 mRNA alone was found to be responsible for the induction of HA secretion by use of siRNAs, which completely and selectively blocked the increases in HAS1 and HAS2 mRNA.
HAS mRNAs have been found to be responsive to TGFβ in a wide variety of cultured cells (13, 15, 16, 23–32). The particular HAS gene involved, however, appears to be highly cell- and tissue-dependent. In synovial fibroblasts TGFβ activates mostly HAS1 (15, 23, 31), whereas HAS3 is up-regulated in chondrocytes and down-regulated in keratinocytes by TGFβ (15, 27, 32, 33). It is interesting to note that two other cell types reported to respond to TGFβ with up-regulation of HAS2 are both derived from the anterior segment of the eye: trabecular meshwork cells and corneal endothelial cells (13, 25).
The dramatic and transient stimulation of HAS mRNA in response to TGFβ appears to be a novel observation of this study, not previously reported in ocular or any other cultured cells. The study also reports several other novel findings. Two HAS mRNAs are up-regulated by TGFβ and one is not, but only one of the two up-regulated HAS mRNAs appears to be involved in induction of HA secreted by these cells. This study provides the first demonstration of knockdown of HAS enzymes in vitro using siRNA, showing that HA but not chondroitin sulfate is altered by this knockdown. Finally, we observed that a wide variety of mitogenic agents up-regulate HAS2 in addition to TGFβ and these act synergistically with TGFβ.
Transient changes in mRNA for signaling molecules in response to TGFβ have been documented (34), but mRNA pools for extracellular matrix molecules typically change much more slowly (10). The HAS2 burst initiates HA secretion by these cells, but after the peak of HAS2 mRNA at 4–6 h the amount drops to only about 2-fold of that in quiescent cells within 48 h (Fig. 4) and remains at the level for at least 7 days (Fig. 7). This is consistent with the rate of HA biosynthesis determined by metabolic labeling (Fig. 2A) and the cell-free biosynthesis rate (Fig. 2C), which do not return to quiescent levels. Thus the conclusion of this study is that HA secretion by keratocytes is closely tied to pool levels for HAS2 mRNA.
The untreated keratocytes do not appear to degrade extracellular HA, but treatment with TGFβ + FBS induced some degradation of exogenously added HA (Fig. 2B) to smaller sized fragments. The increased degradation may contribute to the reduced HA recovered from culture medium after TGFβ treatment, but the data showing that the biosynthetic rate markedly decreases after 12 h (Fig. 2C) suggest that degradation is not the major cause of decreased recovery of HA. Jenkens et al. (22) have shown that in cultured lung fibroblasts, increased HA in the culture medium in response to TGFβ resulted from decreased degradation of extracellular HA via action of secreted hyaluronidases 1 and 2. HA accumulation by primary keratocytes, however, cannot be attributed to a similar mechanism, because the quiescent cells do not appear to degrade exogenous HA. Differences in the results of the two studies may be due to differing culture conditions, i.e. passaged fibroblasts in serum versus primary keratocytes in serum-free media, or from intrinsic differences in the cell types.
Despite up-regulation of two HAS mRNAs, our results show that only HAS2 appears to be involved in the secretion of HA by these cells. Quantification of these two mRNAs indicated that at their maximum concentrations HAS2 was about 40-fold more abundant than HAS1 on a molecules/cell basis (data not shown). HAS1 mRNA pools fully returned to the level seen in quiescent cells, whereas HAS2 did not. It should be noted that the data in this study link HAS2 only with HA recovered from the culture medium. Intracellular HA has been observed in some cells, and cell-associated HA is common in cultured cells. Our results do not rule out the possibility that HA polymerized by HAS1 could be present as a cell-associated or intracellular form, whereas HAS2 is responsible for secreted HA.
We found HAS2 to be up-regulated by a variety of mitogens inducing cell division in keratocytes, including PDGF, fibroblast growth factor 2, insulin-like growth factor 1, and FBS. It was surprising to find that heparin-stripped horse serum and lipid-rich bovine serum albumin, agents with little or no mitogenic activity in keratocytes, also stimulated HAS2 to the same level. Previous studies have shown that extracellular matrix components such as collagen and fibronectin can be up-regulated by albumin and by fatty acids (such as are present in horse serum) (35–37). The response of the HAS2 gene to low mitogen serum and to serum albumin in keratocytes may represent a similar mode of response.
We also observed TGFβ to be strongly stimulatory and synergistic with other mitogens in inducing HAS2. The HAS2 gene contains a number of promoter elements, presenting the possibility of multiple modes of transcriptional activation of HAS2 gene expression (38). The presence of such multiple activation sites is consistent with a molecular mechanism involving separate and synergistic stimulatory pathways by TGFβ combined with other growth factors.
The increases in HAS mRNA and HA secretion found by this study take place much more rapidly than previously documented keratocyte responses to serum or TGFβ. Our previous studies found changes in secretion of dermatan sulfate and keratan sulfate by these cells to occur over a period of 2 or more days after exposure to TGFβ. Maximum alterations in the mRNA pools for collagen III, EDA-fibronectin, and biglycan also required several days of stimulation by TGFβ. The magnitude of the changes in HAS2 mRNA in response to TGFβ was large (up to 150-fold) compared with the changes we documented for mRNAs of other matrix components. The rapidity, magnitude, and transient nature of the response of HAS2 suggest a functional role for HA in later events of the transdifferentiation of keratocytes to myofibroblasts. HA and HA fragments elicit motility and cell cycle entry from a number of cell types (6, 39, 40). It therefore seems likely that a burst of HA synthesis coupled with increased HA degradation could elicit a similar response from keratocytes as well. Initial responses of keratocytes to corneal wounding involve migration toward the site of the injury followed by mitosis. Thus, the HA secreted by keratocytes early in the healing process may play a functional role in initiating the complex program of responses exhibited by cell wound healing in vivo.
Acknowledgments
We thank Paraskevi Heldin for comments on the manuscript and Cindy Stone for help with histology.
Footnotes
This work was supported by National Institutes of Health Grants EY09368 and P30-EY08098, Research to Prevent Blindness, and the Eye and Ear Foundation of Pittsburgh.
The abbreviations used are: HA, hyaluronan; TGFβ, transforming growth factor beta; HAS, hyaluronan synthase; FBS, fetal bovine serum; FACE, fluorophore-assisted carbohydrate electrophoresis; HABP, hyaluronan-binding protein; qRT, quantitative reverse transcriptase; siRNA, small interfering RNA; ELISA, enzyme-linked immunosorbent assay; PBS, phosphate-buffered saline; DME, Dulbecco’s modified Eagle’s; PDGF, platelet-derived growth factor
REFERENCES
- 1.Spicer AP, Tien JY. Birth Defects Res. C Embryo Today. 2004;72:89–108. doi: 10.1002/bdrc.20006. [DOI] [PubMed] [Google Scholar]
- 2.Fitzsimmons TD, Molander N, Stenevi U, Fagerholm P, Schenholm M, von Malmborg A. Investig. Ophthalmol. Vis. Sci. 1994;35:2774–2782. [PubMed] [Google Scholar]
- 3.Hassell JR, Cintron C, Kublin C, Newsome DA. Arch. Biochem. Biophys. 1983;222:362–369. doi: 10.1016/0003-9861(83)90532-5. [DOI] [PubMed] [Google Scholar]
- 4.Hirsch M, Prenant G, Renard G. Exp. Eye Res. 2001;72:123–135. doi: 10.1006/exer.2000.0935. [DOI] [PubMed] [Google Scholar]
- 5.Meek KM, Leonard DW, Connon CJ, Dennis S, Khan S. Eye (Lond.) 2003;17:927–936. doi: 10.1038/sj.eye.6700574. [DOI] [PubMed] [Google Scholar]
- 6.Toole BP. Nat. Rev. Cancer. 2004;4:528–539. doi: 10.1038/nrc1391. [DOI] [PubMed] [Google Scholar]
- 7.Beales MP, Funderburgh JL, Jester JV, Hassell JR. Investig. Ophthalmol. Vis. Sci. 1999;40:1658–1663. [PubMed] [Google Scholar]
- 8.Funderburgh JL, Mann MM, Funderburgh ML. J. Biol. Chem. 2003;278:45629–45637. doi: 10.1074/jbc.M303292200. [DOI] [PMC free article] [PubMed] [Google Scholar]
- 9.Long CJ, Roth MR, Tasheva ES, Funderburgh M, Smit R, Conrad GW, Funderburgh JL. J. Biol. Chem. 2000;275:13918–13923. doi: 10.1074/jbc.275.18.13918. [DOI] [PubMed] [Google Scholar]
- 10.Funderburgh JL, Funderburgh ML, Mann MM, Corpuz L, Roth MR. J. Biol. Chem. 2001;276:44173–44178. doi: 10.1074/jbc.M107596200. [DOI] [PMC free article] [PubMed] [Google Scholar]
- 11.Itano N, Sawai T, Yoshida M, Lenas P, Yamada Y, Imagawa M, Shinomura T, Hamaguchi M, Yoshida Y, Ohnuki Y, Miyauchi S, Spicer AP, McDonald JA, Kimata K. J. Biol. Chem. 1999;274:25085–25092. doi: 10.1074/jbc.274.35.25085. [DOI] [PubMed] [Google Scholar]
- 12.Itano N, Kimata K. IUBMB Life. 2002;54:195–199. doi: 10.1080/15216540214929. [DOI] [PubMed] [Google Scholar]
- 13.Usui T, Amano S, Oshika T, Suzuki K, Miyata K, Araie M, Heldin P, Yamashita H. Investig. Ophthalmol. Vis. Sci. 2000;41:3261–3267. [PubMed] [Google Scholar]
- 14.Pienimaki JP, Rilla K, Fulop C, Sironen RK, Karvinen S, Pasonen S, Lammi MJ, Tammi R, Hascall VC, Tammi MI. J. Biol. Chem. 2001;276:20428–20435. doi: 10.1074/jbc.M007601200. [DOI] [PubMed] [Google Scholar]
- 15.Recklies AD, White C, Melching L, Roughley PJ. Biochem. J. 2001;354:17–24. doi: 10.1042/0264-6021:3540017. [DOI] [PMC free article] [PubMed] [Google Scholar]
- 16.Usui T, Nakajima F, Ideta R, Kaji Y, Suzuki Y, Araie M, Miyauchi S, Heldin P, Yamashita H. Br. J. Ophthalmol. 2003;87:357–360. doi: 10.1136/bjo.87.3.357. [DOI] [PMC free article] [PubMed] [Google Scholar]
- 17.Wilkinson TS, Potter-Perigo S, Tsoi C, Altman LC, Wight TN. Am. J. Respir. Cell Mol. Biol. 2004;31:92–99. doi: 10.1165/rcmb.2003-0380OC. [DOI] [PubMed] [Google Scholar]
- 18.Saavalainen K, Pasonen-Seppanen S, Dunlop TW, Tammi R, Tammi MI, Carlberg C. J. Biol. Chem. 2005;280:14636–14644. doi: 10.1074/jbc.M500206200. [DOI] [PubMed] [Google Scholar]
- 19.Shimabukuro Y, Ichikawa T, Takayama S, Yamada S, Takedachi M, Terakura M, Hashikawa T, Murakami S. J. Cell. Physiol. 2005;203:557–563. doi: 10.1002/jcp.20256. [DOI] [PubMed] [Google Scholar]
- 20.Funderburgh ML, Du Y, Mann MM, Sundarraj N, Funderburgh JL. FASEB J. 2005;19:1371–1373. doi: 10.1096/fj.04-2770fje. [DOI] [PMC free article] [PubMed] [Google Scholar]
- 21.Plaas AH, West L, Midura RJ, Hascall VC. Methods Mol. Biol. 2001;171:117–128. doi: 10.1385/1-59259-209-0:117. [DOI] [PubMed] [Google Scholar]
- 22.Jenkins RH, Thomas GJ, Williams JD, Steadman R. J. Biol. Chem. 2004;279:41453–41460. doi: 10.1074/jbc.M401678200. [DOI] [PubMed] [Google Scholar]
- 23.Oguchi T, Ishiguro N. Connect Tissue Res. 2004;45:197–205. doi: 10.1080/03008200490523031. [DOI] [PubMed] [Google Scholar]
- 24.Stuhlmeier KM, Pollaschek C. J. Biol. Chem. 2004;279:8753–8760. doi: 10.1074/jbc.M303945200. [DOI] [PubMed] [Google Scholar]
- 25.Suzuki K, Yamamoto T, Usui T, Heldin P, Yamashita H. Jpn. J. Ophthalmol. 2003;47:557–564. doi: 10.1016/j.jjo.2003.09.001. [DOI] [PubMed] [Google Scholar]
- 26.Stuhlmeier KM, Pollaschek C. Rheumatology (Oxf.) 2004;43:164–169. doi: 10.1093/rheumatology/keh014. [DOI] [PubMed] [Google Scholar]
- 27.Sayo T, Sugiyama Y, Takahashi Y, Ozawa N, Sakai S, Ishikawa O, Tamura M, Inoue S. J. Investig. Dermatol. 2002;118:43–48. doi: 10.1046/j.0022-202x.2001.01613.x. [DOI] [PubMed] [Google Scholar]
- 28.Haase HR, Bartold PM. J. Periodontol. 2001;72:341–348. doi: 10.1902/jop.2001.72.3.341. [DOI] [PubMed] [Google Scholar]
- 29.Jacobson A, Brinck J, Briskin MJ, Spicer AP, Heldin P. Biochem. J. 2000;348:29–35. [PMC free article] [PubMed] [Google Scholar]
- 30.Nishida Y, Knudson CB, Kuettner KE, Knudson W. Osteoarthr. Cartil. 2000;8:127–136. doi: 10.1053/joca.1999.0281. [DOI] [PubMed] [Google Scholar]
- 31.Haubeck HD, Kock R, Fischer DC, van de Leur E, Hoffmeister K, Greiling H. Arthritis Rheum. 1995;38:669–677. doi: 10.1002/art.1780380515. [DOI] [PubMed] [Google Scholar]
- 32.Hiscock DR, Caterson B, Flannery CR. Osteoarthr. Cartil. 2000;8:120–126. doi: 10.1053/joca.1999.0280. [DOI] [PubMed] [Google Scholar]
- 33.Pasonen-Seppanen S, Karvinen S, Torronen K, Hyttinen JM, Jokela T, Lammi MJ, Tammi MI, Tammi R. J. Investig. Dermatol. 2003;120:1038–1044. doi: 10.1046/j.1523-1747.2003.12249.x. [DOI] [PubMed] [Google Scholar]
- 34.Lafon C, Mazars P, Guerrin M, Barboule N, Charcosset JY, Valette A. Biochim. Biophys. Acta. 1995;1266:288–295. doi: 10.1016/0167-4889(95)00023-l. [DOI] [PubMed] [Google Scholar]
- 35.Arici M, Brown J, Williams M, Harris KP, Walls J, Brunskill NJ. Nephrol. Dial. Transplant. 2002;17:1751–1757. doi: 10.1093/ndt/17.10.1751. [DOI] [PubMed] [Google Scholar]
- 36.Jia Y, Turek JJ. Exp. Biol. Med. (Maywood) 2004;229:676–683. doi: 10.1177/153537020422900712. [DOI] [PubMed] [Google Scholar]
- 37.Stephan JP, Mao W, Filvaroff E, Cai L, Rabkin R, Pan G. Am. J. Nephrol. 2004;24:14–19. doi: 10.1159/000075347. [DOI] [PubMed] [Google Scholar]
- 38.Monslow J, Williams JD, Guy CA, Price IK, Craig KJ, Williams HJ, Williams NM, Martin J, Coleman SL, Topley N, Spicer AP, Buckland PR, Davies M, Bowen T. J. Biol. Chem. 2004;279:20576–20581. doi: 10.1074/jbc.M312666200. [DOI] [PubMed] [Google Scholar]
- 39.Hascall VC, Majors AK, De La Motte CA, Evanko SP, Wang A, Drazba JA, Strong SA, Wight TN. Biochim. Biophys. Acta. 2004;1673:3–12. doi: 10.1016/j.bbagen.2004.02.013. [DOI] [PubMed] [Google Scholar]
- 40.Adamia S, Maxwell CA, Pilarski LM. Curr. Drug Targets Cardiovasc. Haematol. Disord. 2005;5:3–14. doi: 10.2174/1568006053005056. [DOI] [PubMed] [Google Scholar]


