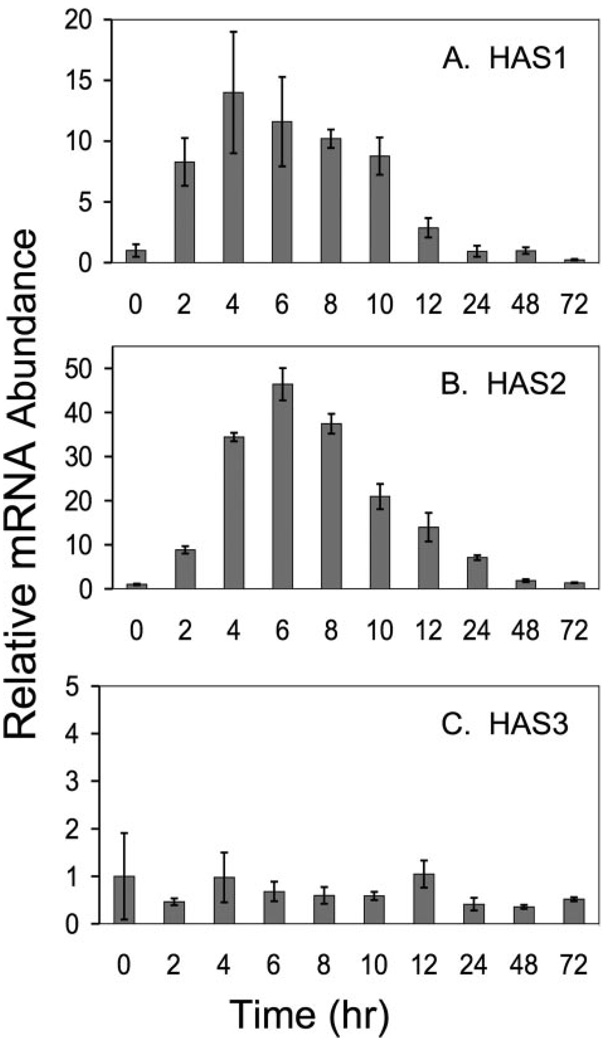
FIGURE 4. Temporal response of HAS mRNA to TGFβ.
Primary bovine keratocytes were exposed to FBS and TGFβ as in Fig. 1, for the intervals shown, and the total RNA was analyzed by qRT-PCR for each gene product compared with 18 S RNA in the same sample as described under “Experimental Procedures.” Bars show the standard error of triplicate analyses carried on duplicate cultures. For each gene, mRNA abundance at time 0 was set to 1.

