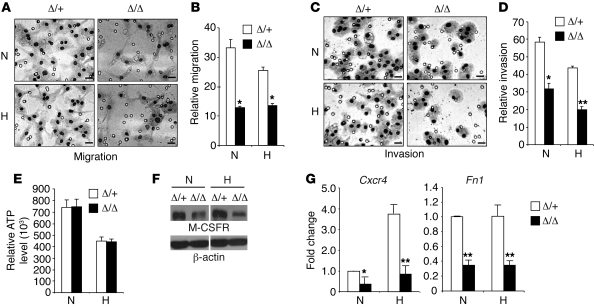
Figure 9. Reduced migration and invasion, but normal ATP production in HIF-2α–deficient macrophages.
(A) BMDMs were exposed to normoxia or hypoxia for 16 hours, and their in vitro migration capacity toward the chemoattractant M-CSF was determined by employing a barrier PET membrane (8 μm; BD Biosciences). Representative images are shown. Scale bars: 20 μm. (B) Quantification of migrated macrophages. Representative data are shown from n = 4 mice (*P < 0.05). (C) Invasion was tested as described above for migration, except that the barrier PET membrane was coated with Matrigel basement membrane matrix (BD Biosciences). Representative images are shown. Scale bars: 20 μm. (D) Quantification of macrophages that invaded through the Matrigel. Representative data from n = 3 mice are shown (*P < 0.05, **P < 0.01). (E) BMDMs were exposed to normoxia or hypoxia for 20 hours, and cellular ATP levels were determined using the ApoGlow Assay kit. Representative data from at least 3 independent experiments are shown. (F) Expression of M-CSFR under normoxia and hypoxia was determined by Western blotting. Representative data from 3 independent experiments are shown. Lanes were run on the same gel but were noncontiguous (white lines). (G) Cxcr4 and Fn1 expression in normoxic and hypoxic BMDMs was evaluated by QRT-PCR. Representative data from at least 3 independent experiments are shown (*P < 0.05, **P < 0.01). N, normoxia (21% O2); H, hypoxia (0.5% O2).

