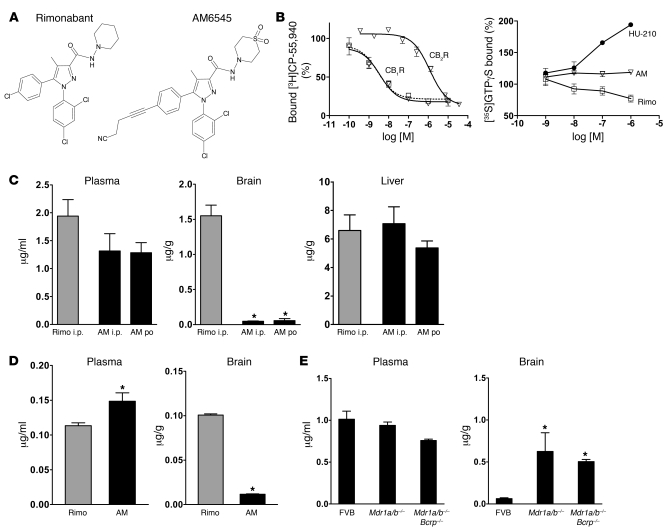
Figure 1. Chemical structure and pharmacological profile of AM6545.
(A) Chemical structure of AM6545 and rimonabant. (B) In vitro interaction of antagonists with CB1R and CB2R: Left: KI values for CB1R (AM6545: 3.3 ± 0.8 nM, rimonabant: 2.9 ± 1.5 nM) and CB2R (AM6545: 624 ± 128 nM) were derived from displacement of [3H]CP-55,940 binding in mouse brain plasma membranes and membranes of HEK293 cells transfected with mouse CB2R, respectively. Right: Agonist effect of HU-210, neutral antagonism by AM6545 (AM), and inverse agonism by rimonabant (Rimo), indicated by increase, no change, and decrease in GTPγS binding, respectively. Data represent percentage of stimulation over basal binding and are mean ± SEM of 3 assays performed in triplicate. (C) Concentration of AM6545 and rimonabant in plasma, brain, and liver, 1 hour after i.p. or po administration by gavage of a dose of 10 mg/kg. Data represent mean ± SEM from 3 mice per group. *P < 0.0001 relative to rimonabant. (D) Brain and plasma concentration of AM6545 and rimonabant 12 hours after dose administration, following daily i.p. dosage at 10 mg/kg for 28 days. Data represent mean ± SEM from 3 mice per group. *P < 0.04 relative to rimonabant. (E) Brain and plasma concentrations of AM6545 in Mdr1a/b–/– and Mdr1a/b–/–Bcrp–/– mice and their wild-type (FVB) controls 1 hour after acute i.p. administration of 10 mg/kg AM6545. Note the dramatic increase in brain levels of AM6545 in the knockout strains relative to wild-type controls. Data represent mean ± SEM from 3 mice per group. *P < 0.01 relative to wild-type controls.

