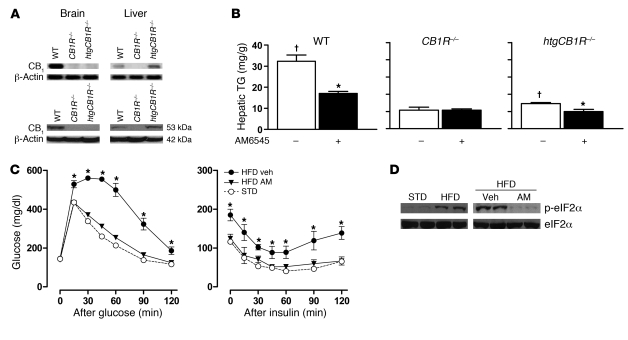
Figure 9. Blockade of hepatic CB1R by AM6545 reverses diet-induced insulin resistance.
(A) CB1R expression in htgCB1R–/– mice is limited to hepatocytes. CB1R mRNA (top) and protein (bottom) are visualized by RT-PCR and Western blotting, respectively, in brain and liver tissue from wild-type, CB1R–/–, and htgCB1R–/– mice. For details, see Methods. (B) Chronic treatment with AM6545 (10 mg/kg/d for 7 days) reduces hepatic TG in wild-type and htgCB1R–/– but not in CB1R–/– mice on HFD. Data represent mean ± SEM from 6 mice per group. *P < 0.05 compared with corresponding vehicle value; †P < 0.05 compared with corresponding value in CB1R–/– mice. (C) htgCB1R–/– mice were kept on STD or HFD for 20 weeks. Mice were then treated with vehicle or AM6545 (10 mg/kg, i.p.) for 7 days and, after overnight fasting, were subjected to an ipGTT (left) followed by ipITT (right). *P < 0.05 compared with corresponding values in vehicle-treated, STD-fed mice. Note the marked glucose intolerance of vehicle-treated mice on HFD relative to both AM6545-treated mice on HFD or the control group on STD (AUC, 426 ± 19 versus 156 ± 6 or 165 ± 47, respectively, n = 6, *P < 0.05). Data represent mean ± SEM from 6 mice per group. (D) Blockade of hepatic CB1R reverses the HFD-induced ER stress response, as indicated by the phosphorylation state of eIF2α.

