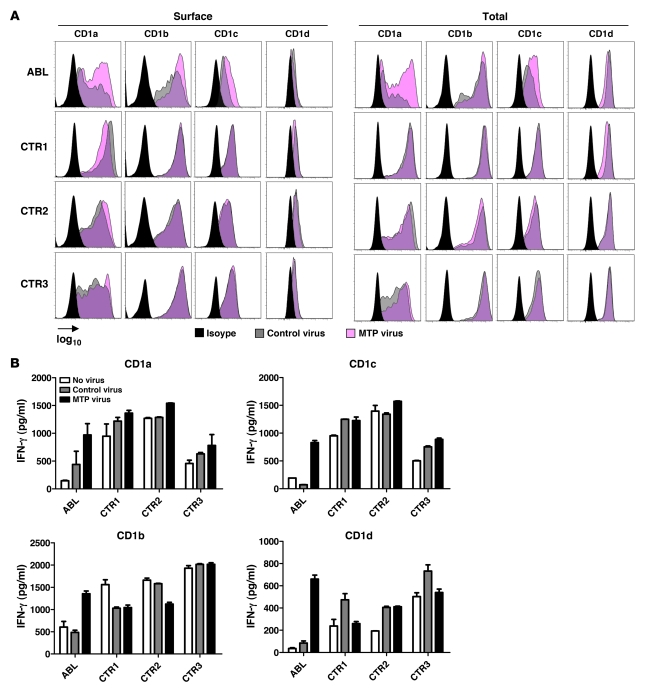
Figure 5. Restoration of CD1 expression and function in ABL upon MTP reconstitution.
(A) Flow cytometric analysis of CD1 expression on ABL or control (CTR) DCs 3 days after infection with lentiviruses expressing MTP or the empty control virus. Shown is the mean fluorescence intensity on a log10 scale. (B) Analysis of CD1-restricted presentation of self lipids 3 days after infection with lentiviruses expressing MTP or the empty control virus. DCs from healthy controls or ABL patients were cocultured with CD1-restricted T cells or iNKT cells. One representative experiment is shown. One additional experiment with cells from independent ABL and control subjects showed comparable results.

