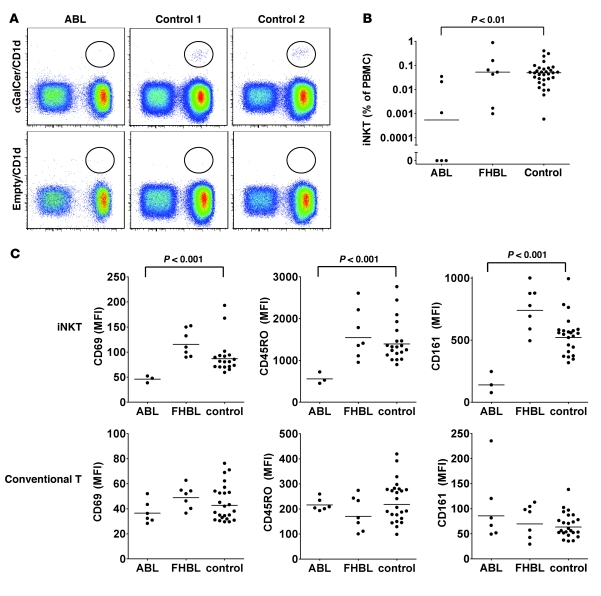
Figure 6. Reduced iNKT levels and an altered iNKT phenotype in ABL.
(A and B) iNKT levels in peripheral blood were determined by staining with αGalCer/CD1d tetramers or empty CD1d tetramers as control and are expressed as percentage of PBMCs. (C) Flow cytometric analysis of expression of cell surface markers on iNKT cells (upper panel) or conventional (tetramer-negative) T cells (lower panel) in peripheral blood. Shown is the mean fluorescence intensity. Dots represent individual subjects. Statistical significance was calculated using the 2-tailed Mann-Whitney U test. Analysis of iNKT surface markers was limited to patients with detectable iNKT cells. Bars indicate the median.

