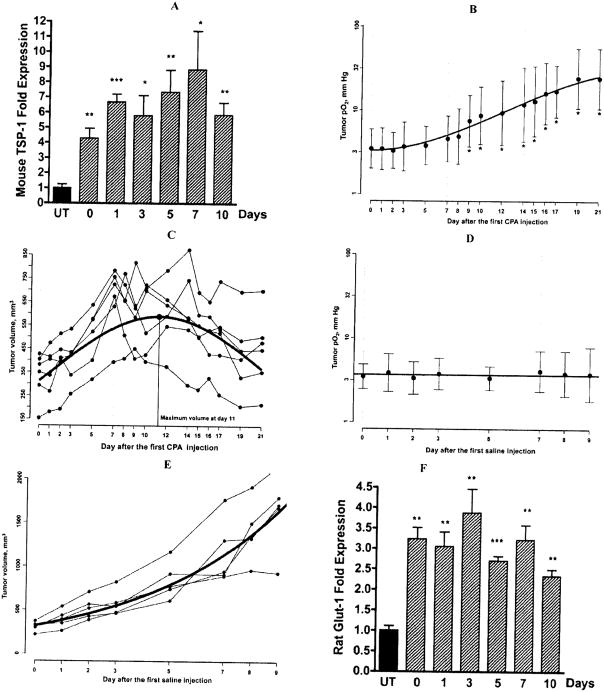
Fig. 1.
A, Expression of mouse TSP-1 mRNA was measured in the days following the second of two weekly CPA treatments (140mg/kg i.p.). TSP-1 expression is presented as fold increase over untreated tumor samples. Metronomic CPA induced more than 8-fold increase in endothelial TSP-1 above the untreated level, Mean ± SE n=4 individual tumors per group. B, Changes in tissue pO2 of subcutaneous 9L tumors in the experimental group. The mice were administered CPA (140mg/Kg, i.p.) on day 0, day 7 and day 14 and the changes in tumor pO2 were repeatedly measured by EPR oximetry, Mean ± SD, n = 6. C, Change in tumor volume of the experimental group, n = 6. D, Lack of change in tissue pO2 of 9L tumors in the control group injected with phosphate buffered saline. Mean ± SD, n = 5 and E, Control group volume measurement, n = 5. F, The expression of rat Glut-1 mRNA was measured in the days following the second of two weekly CPA treatments (140mg/kg i.p.). Metronomic CPA induced a 4-fold increase in rat Glut-1 expression above the untreated level, Mean ± SE n=4 individual tumors per group. Statistical comparisons using a two-tailed Student’s test were performed using Prism software version 4 (Graph-Pad Software, San Diego, CA), *: p< 0.05 and **: p < 0.01.

