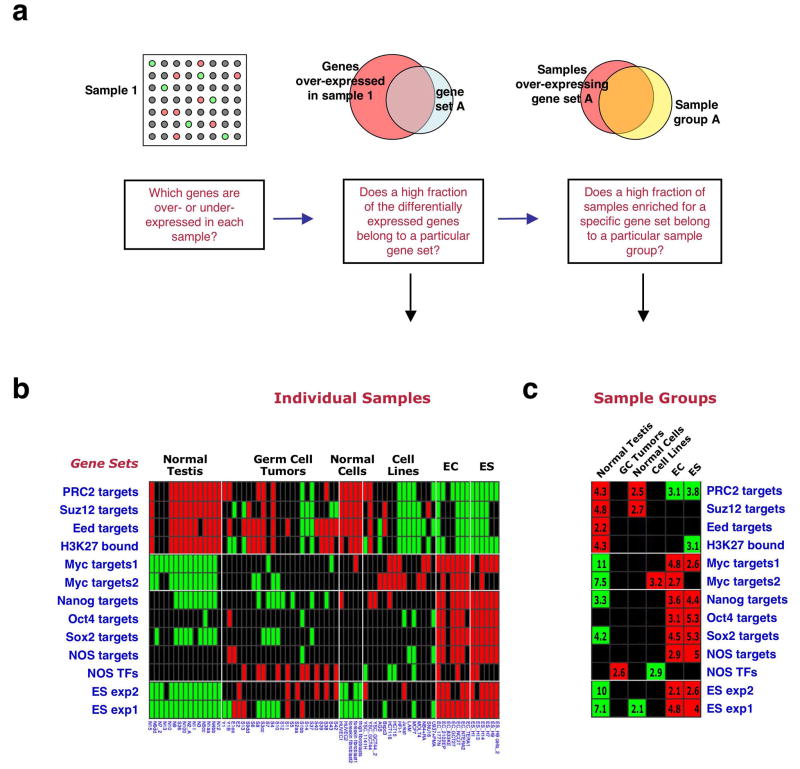
Figure 1. An ES cell gene-set enrichment pattern.
(a) Analysis method of gene set enrichment pattern18. For each sample (array) genes over- and under- expressed relative to the mean across samples are scored. The fraction of these differentially expressed genes that belong to each of the tested gene sets is then calculated, and its significance over random is estimated, producing a P value. In the second step of the analysis, the over-representation of particular sample groups among the samples enriched for each gene set is assessed. (b) Gene set enrichments in ES cells compared to other cell types. Columns represent individual samples (sample annotations on bottom), sample group names are indicated above. Rows represent individual gene sets (names indicated on left). Red – gene-set enrichment for overexpression, green - gene-set enrichment for underexpression, black – no significant enrichment. (c) Enrichment pattern across sample groups. Numbers indicate P-values for gene set enrichment significance within sample group, in negative log, e.g., 4 symbolizes P=10-4.

