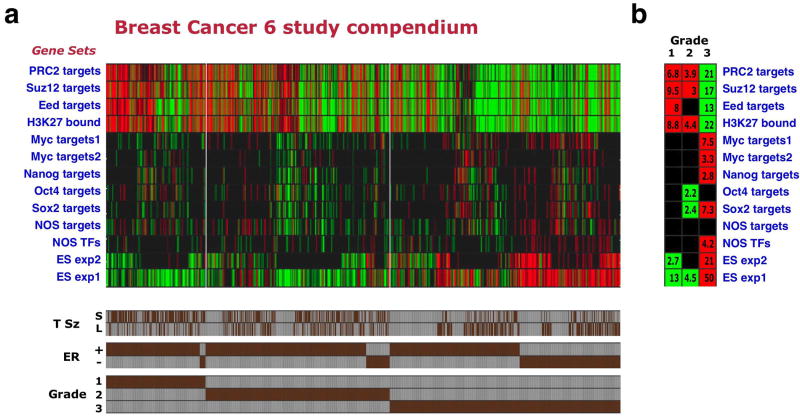
Figure 2. Poorly differentiated breast cancers display an ES-like enrichment pattern.
(a) Enrichment pattern of indicated gene sets (rows) across 1,211 breast cancer samples included in 6 profiling studies (columns). Red/green – significantly over- or underexpressed gene sets. Shown are 1,089 tumors for which both ER status and grade annotations were available. Brown bars (bottom) indicate individual tumor annotations for grade, ER status, and tumor size (T Sz), where available. S – tumor smaller than 2cm across (pathological T1), L – tumor larger than 2cm (pathological T2 or T3). (b) Gene set enrichments in the breast compendium tumors stratified by tumor grade.

