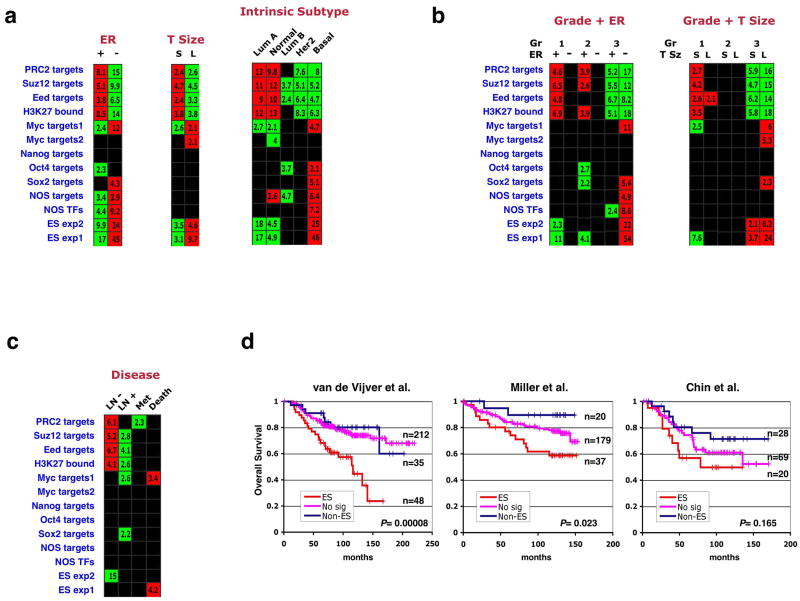
Figure 3. Association of the ES signature with ER status, tumor size, intrinsic subtype, and prognostic outcome in breast cancers.
(a) Gene set enrichments in the breast compendium tumors stratified by ER status, tumor size (T Size) or intrinsic subtype. Stratification for the latter parameter was done by employing an expression-profile based classification method35,48. S – small, L – large, Lum – luminal. (b) Samples were divided into six groups representing different combinations of tumor grade and ER-status, and enrichment of gene sets was tested across these groups (left). A similar analysis was performed for grade and tumor size (right). (c) Enrichments in tumors stratified by lymph-node metastasis absence (LN-) or presence (LN+), distant metastasis (Met), or disease-induced mortality (Death). (d) Kaplan-Meier analyses of overall survival in patients included in three of the five studies analyzed. Patients showing both overexpression of the ES exp1 set and underexpression of the PRC2 targets set were labeled as ES (red), those showing the reversed pattern were labeled as Non-ES (blue), and the remainder were labeled as No signature (No sig, pink). P values indicate significance of survival difference between the ES patient group and all other patients.

