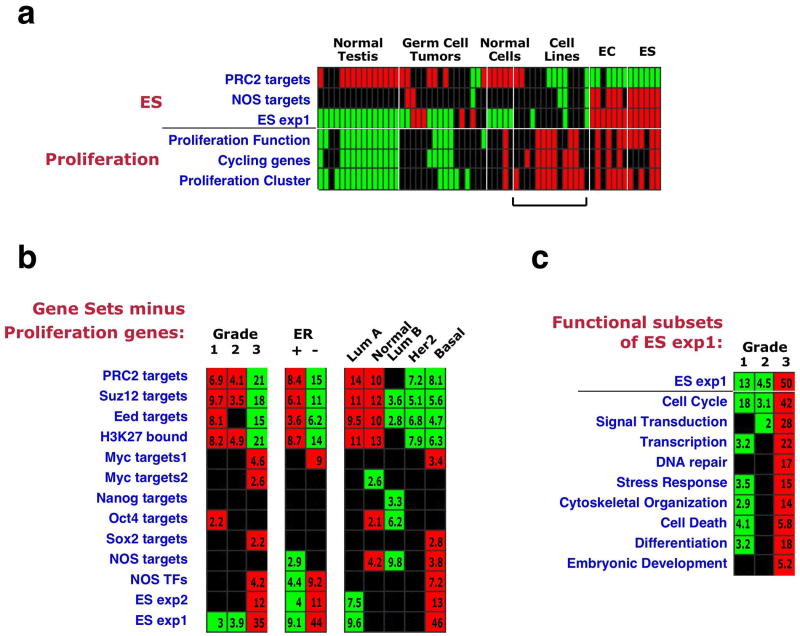
Figure 4. Contribution of proliferation-associated genes to the ES signature.
(a) Enrichment patterns in individual samples of ES cells and other cell types27 of the indicated ES gene sets (as in Fig. 1), and of three Proliferation gene sets: Proliferation Function - genes functionally associated with cell proliferation (compiled from several GO categories), Cycling Genes – genes showing cell-cycle stage-specific expression40, Proliferation Cluster – defined in tumor expression data35. Bar indicates difference in enrichment pattern between ES gene sets and proliferation gene sets in cultured tumor cell lines. (b) Gene set enrichment patterns across grade, ER-status and intrinsic subtypes after subtraction of the Proliferation Function genes from all gene sets. Subtraction of the two other proliferation sets is shown in Supplementary Fig. 2. (c) Enrichment pattern across grade of different subsets of the ES exp1 gene set, based on their cellular function (GO).

