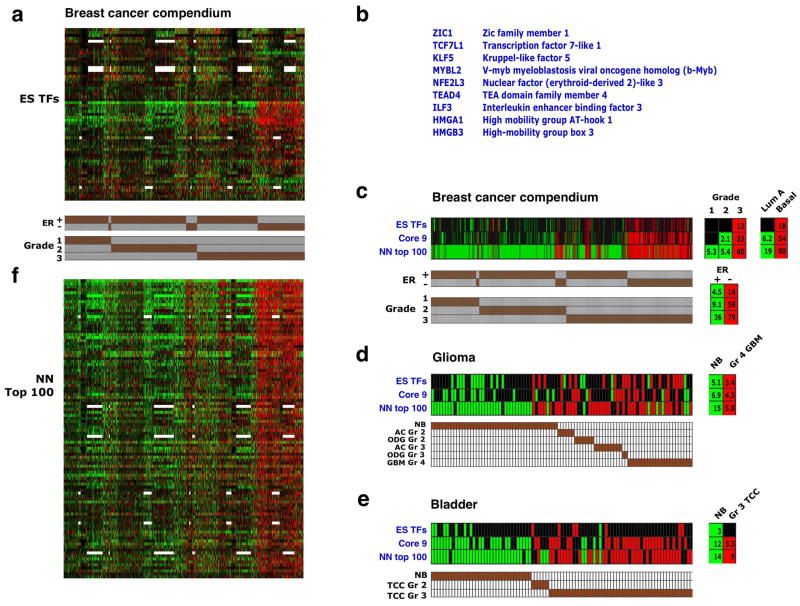
Figure 6. A core set of ES-associated transcription factors is overexpressed in high-grade tumors.
(a) Expression pattern of 59 genes encoding ES-associated transcription regulators (rows) across the breast cancer compendium samples (columns), sorted by grade and ER status (indicated in bottom). 12 additional genes in the ES TFs set were not represented in most of the arrays used are therefore not shown. Red/green – two-fold or higher over- or underexpression, respectively. White – missing data. (b) Core set of 9 closely correlated ES transcription regulators, as determined by the pvclust method (Supplementary Figure 4b). (c) Gene set enrichment in the breast cancer compendium samples of the 68 ES-associated transcription regulators (ES TFs), the Core 9 gene subset (Core 9), and top ranking 100 genes in the nearest neighbor expression correlation analysis (NN top 100) – see panel f. Shown are enrichments in individual tumors and in tumors stratified by grade, ER status and intrinsic subtype. Only samples showing enrichment for at least one set are presented. (d) Analysis as in C in glioma samples. NB – normal brain, other annotations as in Figure 5a. (e) Analysis as in C in bladder carcinoma samples. NB – normal bladder, other annotations as in Figure 5b. (f) 1,700 transcription regulators in the human genome were ranked according to the similarity of their expression pattern in the breast cancer compendium to the expression of the Core 9 gene cluster (nearest neighbor analysis). Shown are the top-ranking 100 genes, in rank order (top down).

