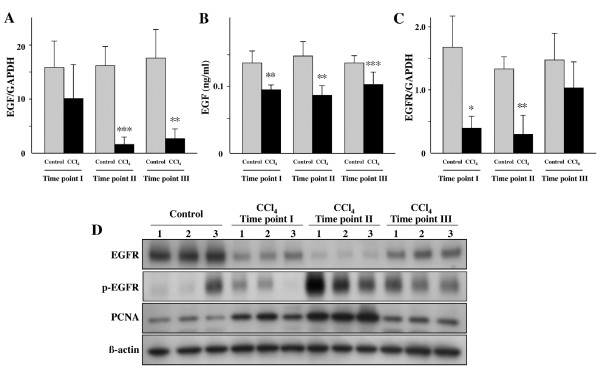
Figure 4.
EGF and EGFR expression was significantly decreased in mice treated with CCl4. EGF expression was determined by (A) quantitative real-time PCR and (B) ELISA. The mRNA expression of (C) EGFR was examined by quantitative real-time PCR. (D) Western blot analysis of three representative liver tissues at each Time point for EGFR, p-EGFR (Y1068), PCNA and β-actin. Each value represents the mean ± SD. *P < 0.05, **P < 0.01 and ***P < 0.001 compared with respective control mice (Time point I: Control group n = 4, CCl4 Group n = 4; Time point II: Control group n = 2, CCl4 Group n = 5, Time point III: Control group n = 5, CCl4 Group n = 9).

