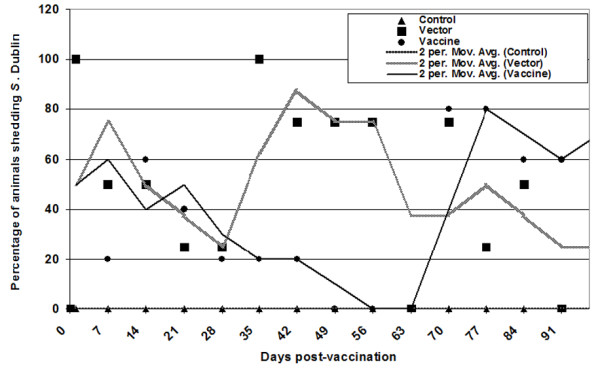
Figure 3.

Duration (x axis) and percentage (y axis) of S. Dublin positive calves as measured by qualitative evaluation of fecal shedding. Calves were inoculated orally as indicated on days 0, 14 and 28. Solid markers (triangle, square or circle) indicate the percentage of calves shedding S. Dublin. A moving average trendline was calculated to normalize fluctuations in shedding. The moving average was calculated by setting the period as 2, with the average of the first two data points used as the first point in the moving average trendline. The average of the second and third data points was used as the second point in the trendline, and subsequent trendline points were calculated accordingly.
